


Civil Structure Strain Monitoring with Power-Efficient, High-Speed Wireless Sensor Networks
J.H. Galbreath*, C.P. Townsend*, S.W. Mundell*, M.J. Hamel*,
B. Esser^, D. Huston, Ph.D.^, S.W. Arms*
Abstract
The goal of this work is to develop and deploy a network of long life, low-cost wireless strain sensors to monitor civil structures. Previous work on RF sensor nodes which transmit periodically to a central receiver using time division multiple access (TDMA) has been reported [1]. With a low power sleep mode and 30 minute sampling interval, this system is estimated to operate for 5 years on one 3.6V Li-Ion AA battery.
However, deployment of the TDMA system on structures underscored the need for a high-speed wireless sensor network with user-triggered and event-triggered data streaming capabilities. To this end, this prompted the development of a second generation datalogging transceiver (75 Kbps , 2MB memory). These systems provide 1KHz, 3-channel data in continuous streaming mode or 2KHz, 3-channel data in data logging mode. The node preserves battery life by entering a low power sleep state. The node periodically awakens and listens for commands, or wakes via eventtriggered interrupt.
This high-speed system was installed on a heavily trafficked bridge in Vermont. Displacement sensors were attached to steel girders for static and dynamic strain measurement. Strain data were acquired via a wireless link. The wireless system is designed to remain long term on the bridge for interrogation under normal and controlled operating conditions.
Author Affiliations Key:
* MicroStrain, Inc., 310 Hurricane Lane, Suite 4, Williston, VT USA 05495 U.S.A.
e-mail: contact@microstrain.com web site: www.microstrain.com
^ University of Vermont, Dept. Of Civil & Mechanical Engineering, Burlington, VT USA 05405
Introduction
Aging civil infrastructure presents a need for an inexpensive, easy to install strain monitoring system [2]. Servicing and installation can form a large portion of the expense of such a system, since human access to civil structures often requires specialized equipment, liability insurance, and vehicle traffic control. Hard-wired systems increase this human access component, with the system distributed over a larger area on the structure. In contrast, a wireless strain monitoring system as shown in Figure 1, only requires access to desired measurement areas, reducing the human access component, and ultimately reducing the cost of implementation.
Objectives
The primary research goals were divided into two categories. The first objective was to build a second-generation, high-speed wireless sensor network, based on a new datalogging transceiver platform. This platform adhered to the following design criteria: 1) high speed wireless sensor streaming 2) minimal, deterministic streaming latency 3) onboard, non-volatile, high capacity data logging 4) advanced sleep modes for long-term deployment 5) interfaces with quarter, half, and full bridge sensors 6) interfaces with magnetic mount DVRT displacement sensors.
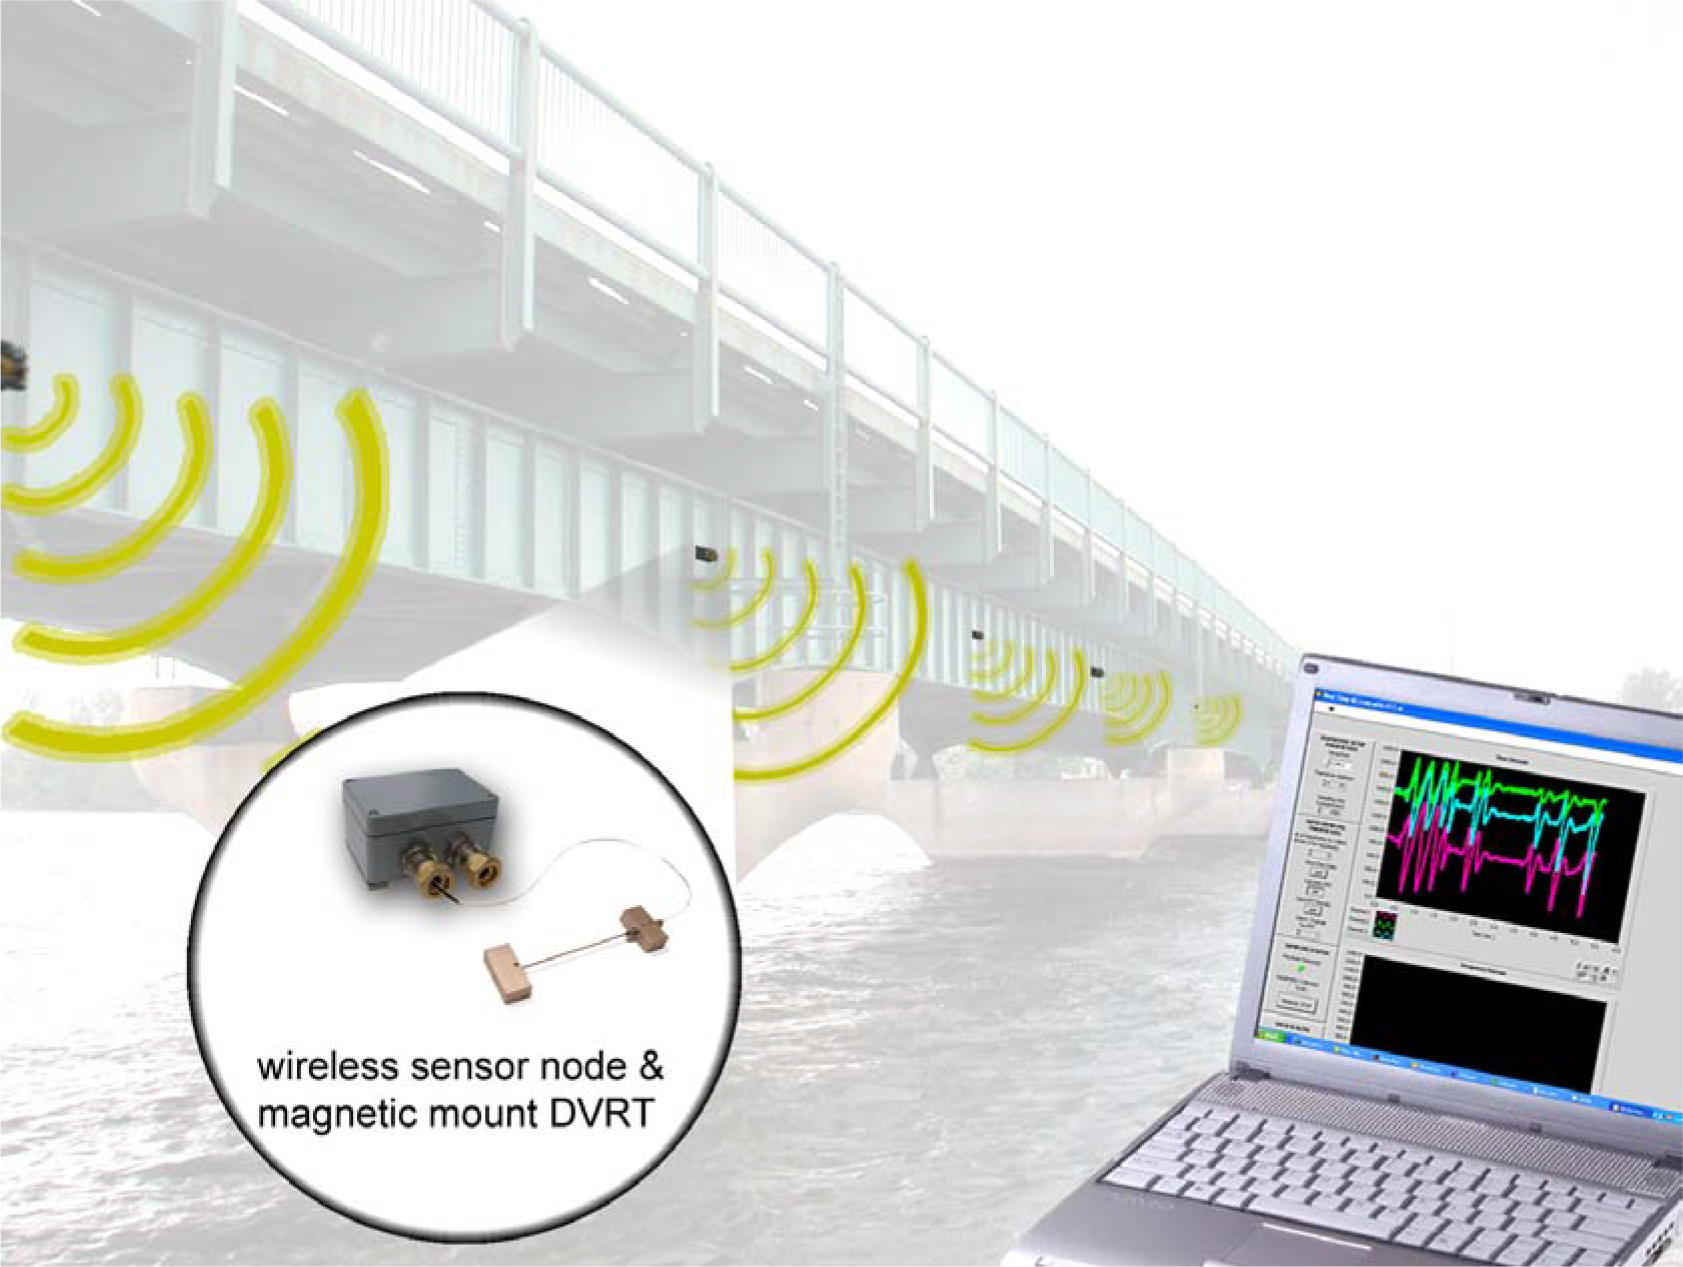
Figure 1. Network of wireless strain sensors, deployed on bridge structure
The second objective was to design a magnetic-mount attachment method for a high-resolution DVRT (differential variable reluctance transducer). The DVRT magnetic mount design would adhere to the following design criteria: 1) simple to attach to steel structures 2) no harm to surface of target structure 3) rugged construction for extended field use 4) highly resistant to slipping or migration due to ambient loads, such as vibrations.
METHODOLOGY
Data Logging Transceiver Architecture
The datalogging transceiver platform was developed from off-the-shelf components, relying on IC’s (integrated circuits) for miniaturization and cost reduction. Figure 2 is a block diagram schematic. The platform has 8 channels of analog input. Channels one through four feature amplified full-differential input, with software programmable gain and offset, with optional bridge excitation and completion for interfacing full, half, or quarter bridge sensors, such as strain gauges and load cells. Channels five through seven provide non-amplified pseudo-differential input, accepting analog voltages between 0 and 3 volts. The last channel is reserved for an onboard solid-state temperature sensor (TC1046, MicroChip Technologies, Chandler AZ). The platform also features three 12-bit digital to analog converters that enable wireless bi-directional control applications.
At the heart of the wireless sensor is a low power 8-bit micro-controller (PIC16F877, MicroChip Technologies) that collects sensor data via an 8-channel, 12- bit successive approximation A/D converter (MCP3208, MicroChip Technologies). This data can then be stored locally to an onboard 2MB flash memory chip (AT45DB41, Atmel Corporation, San Jose CA), or streamed wirelessly. If the latter collection method is chosen, a half-duplex, narrowband ASK transceiver (DR-3000-1 RF Monolithics, Dallas TX) sends the sensor data at 75 Kbps, over a 916.5 MHz carrier.
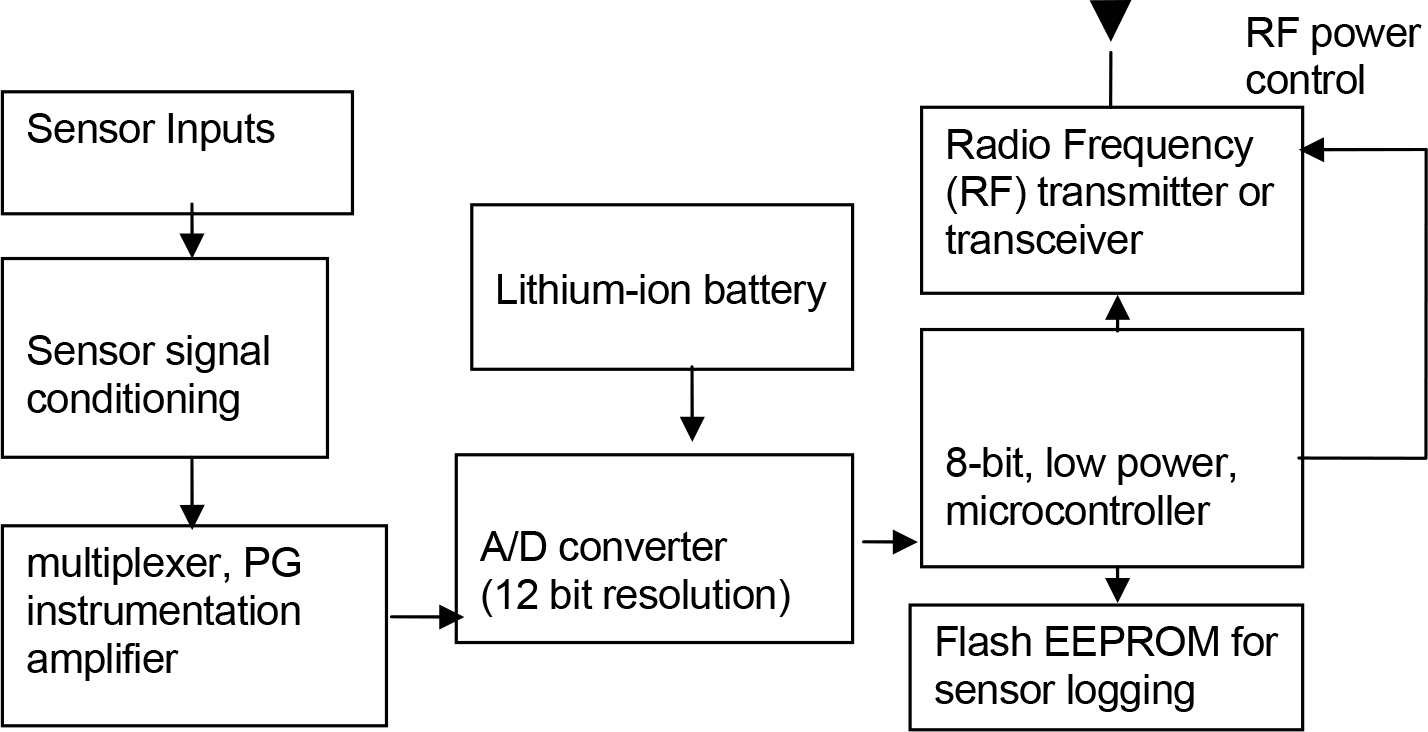
Figure 2. Datalogging transceiver block diagram
TABLE I. SAMPLE RATE VS. NUMBER OF ACTIVE CHANNELS
![]()
On the user/controller-end, a base-station with the same telemetry hardware receives the incoming data stream, and forwards the data to a PC via a standard RS- 232 serial port. Since the telemetry hardware is bi-directional, the base station can also send commands and data to the remote nodes. This allows the user to reconfigure the operational parameters of the nodes wirelessly, and trigger data collection sessions. The network topology was implemented as a single-hop, hierarchical model, capable of supporting hundreds of nodes per base-station. Combined with the welldefined behavior of the narrowband RF transceiver, the topology enabled a minimal and deterministic sensor streaming latency. The system latency was measured to be less than 2 ms by measuring the time between an A/D sample on the remote node, and reception of this data on the serial port of a PC.
Wireless sensor streaming occurs at a fixed rate of 75 Kbps, which allows for approximately 1700 data points per second, depending on the number of active channels. This relationship is shown in Table 1. Error detection is accomplished with a checksum byte for each sweep (defined as a frame containing a sample of each active channel). This error detection scheme was chosen due to its low overhead requirements, which allowed for greater data throughput.
Datalogging occurs at one of seven user-selected sample rates between 32 Hz and 2048 Hz. This is a sweep rate, covering all active channels, with a maximum aggregate bandwidth of 16,384 data points per seconds (when all eight channels are selected). This information is stored on a 2 megabyte, non-volatile flash memory chip. Since access to civil structures can be limited, battery life was one of the most important design considerations for the datalogging transceiver. RF communications often dominate energy consumption in wireless sensing applications [3], so it was
important to develop a communications protocol that minimizes radio usage on the remote node. Table 2 lists the power requirements of the wireless sensor. (All measurements are taken when interfaced to a single 1000-ohm full bridge strain gauge sensor).
It was also important to implement intelligent sleep states, since the nodes would remain on the bridge for large periods of time without user-interaction. The microcontroller on the remote node features a low power sleep mode that can be exited via a watch-dog timer, or an external interrupt. This enabled two low-power monitoring modes.
TABLE II. REMOTE NODE POWER REQUIREMENTS
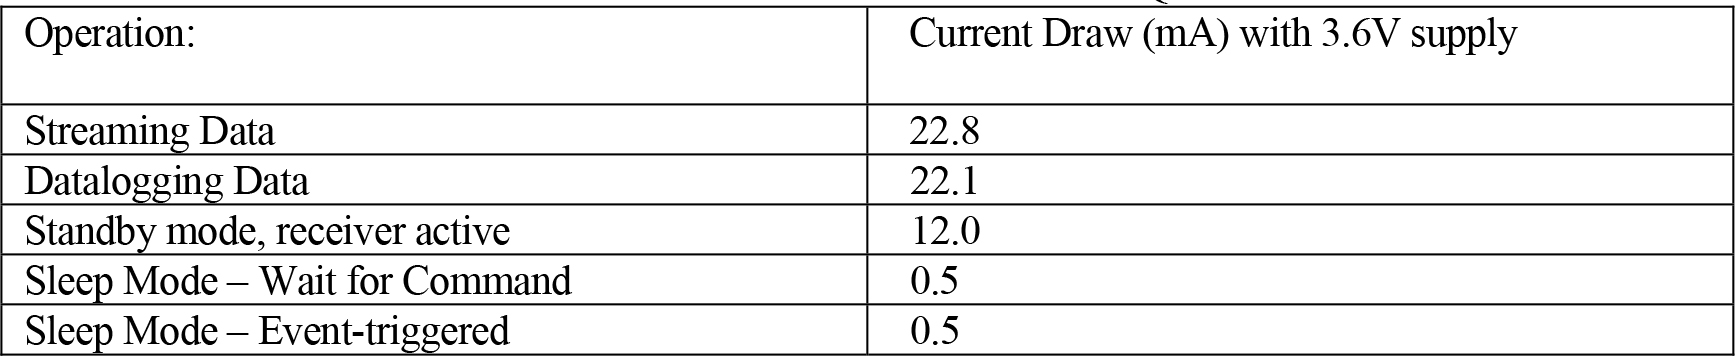
In the first mode, the microcontroller periodically awakes via a watchdog timer interrupt, turns on the telemetry hardware, and listens for a wake command from the base station. If it does not detect a wake command within 50msec, it returns to the same sleep mode. In the second mode, the microcontroller remains in the low power sleep mode until a rising external analog voltage triggers a hardware interrupt.
For the first anticipated test application (scheduled monitoring of strain on a bridge), the following design assumptions were used to estimate battery life. The bridge is to be inspected once a month, requiring that the remote nodes collect data for approximately two hours per session. In addition, the nodes would need to remain in standby mode for six hours during these twelve scheduled inspections. Based on these requirements, the nodes were equipped with a 3.6V, 19 amp-hour, lithium thionylchloride battery (D-Cell, Tadiran Lithium Batteries, Port Washington, NY) which should last an estimated three and a half years.
Magnetic Mount DVRT Strain Sensor
Following consultation with the bridge owners (Vermont Agency of Transportation) it was determined that no epoxy, welds or other permanent fixtures be used to attach the strain sensors. These constraints led to the development of rapidly attachable compliant sensor that does not alter or permanently bond to the steel. The design used a magnetically-attached ultra-high resolution DVRT displacement sensor. Variable reluctance transducers have been used successfully in both large scale [4] and high resolution strain measurements [5]. For this application, the transducer uses two
neodymium magnets for attachment. The magnets are shielded from the sensor by a 416 stainless steel cup. This cup concentrates the flux lines and increases the holding power to about 45 N.
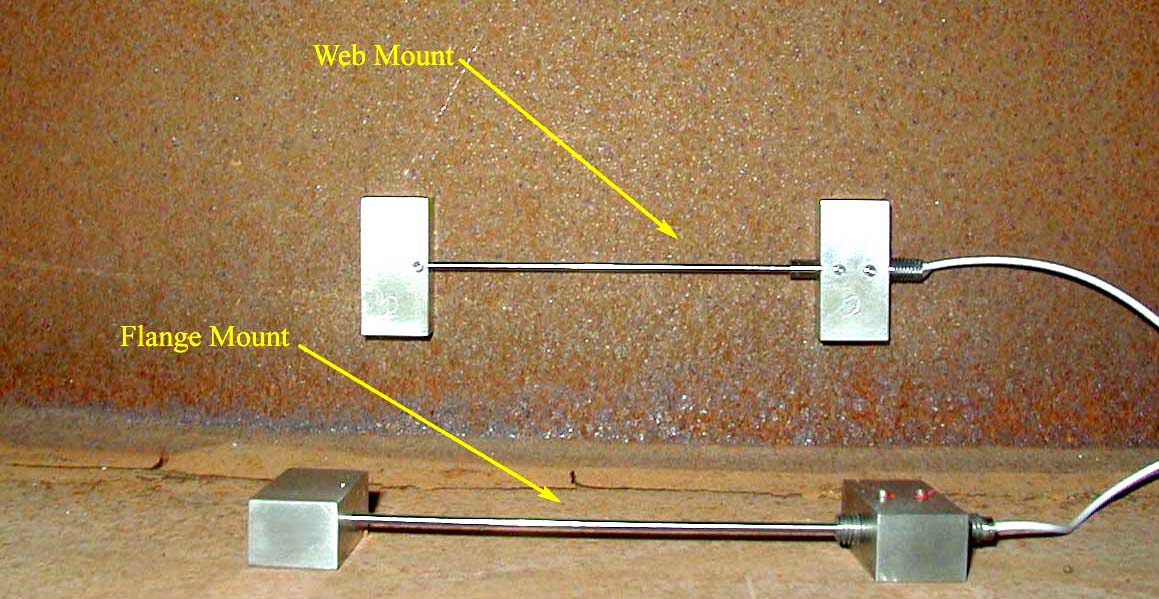
Figure 3. Magnetic Mount DVRT Sensors
The chosen displacement transducer is a DVRT (NANO-DVRT, MicroStrain, Williston VT) and inline signal conditioner (DC-DEMOD, MicroStrain). This sensor is capable of linear displacement measurements with a resolution of 10 nanometers. As shown in Figure 3, each DVRT sensor required two magnetic mount blocks to attach to the target structure. The body of the sensor was mounted within one block and the ferrous core was mounted to the other block with a 100 mm long rod. The configuration results in a strain sensor with a gauge length of 100 mm. In this
configuration, one microstrain experienced over the 100 mm of substrate corresponded to 100 nanometers of core displacement. A machined aluminum spacing jig was used as an installation tool that guaranteed consistent spacing and angular alignment while allowing the core to slide freely, Figure 4.
For long-term stability, the attachments between the sensors and the steel beam must remain in permanent contact with no relative motion at the contact pads. The shear force resistance of the attachments was tested by applying a shear load with a calibrated “S” type load cell (Model 363, Revere Transducers, Tustin CA) and reading the DVRT output. When the applied shear load is high enough to move the attachment pad, the DVRT core begins to move within the sensor and is detected. Multiple types of changes in the interface between the metal attachment and the substrate were also tested, with the idea that a high friction interface would make the magnetic attachments hold even better. A diamond knurl pattern was machined directly onto the base of the stainless steel attachment. This knurl pattern significantly increased the coefficient of friction between the attachment and the substrate under test, and the reactive force was increased from approximately 9 Newtons to about 13 Newtons. This design was deemed to be the best candidate for use in field-deployable sensors.
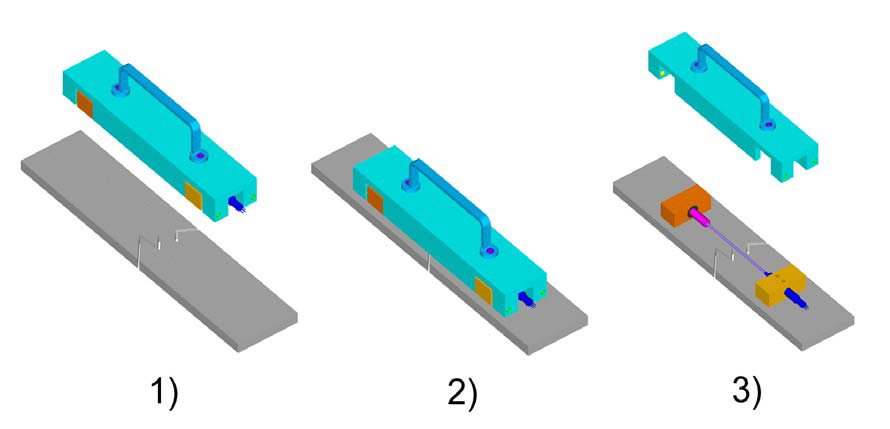
Figure 4. Magnetic Mount DVRT Sensor Installation
Test Methods to compare DVRT with Conventional Foil Strain Gauge
Data were collected with both a magnetic mount DVRT sensor and a half bridge bonded foil strain gauge (1000 Ohms, Micro-Measurements, Raleigh, NC) mounted on a cantilevered steel beam (5.08cm x 0.64 cm, constant cross section). The beam was resonant in bending at ~20 Hz. To initiate a test, the beam was flexed and then released, creating a cyclic bending strain which exponentially decayed. The strain levels were approximately +/- 200 microstrain (peak-to-peak). Analog voltages from the DVRT signal conditioning and the strain gauge conditioner were recorded by a digital storage oscilloscope. Figure 5 is photograph of this test setup.
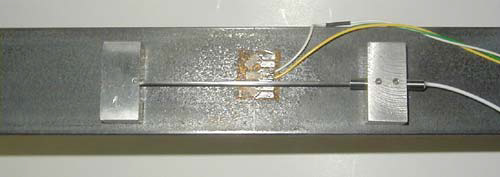
Figure 5. Magnetic Mount DVRT and Bonded Foil Strain Gauge on Steel Beam
Test Methods to Determine Temperature Coefficients
To determine the offset and span coefficients of the DVRT strain gauge, two test methods were employed. The first utilized an Invar block, to which the DVRT was affixed with magnetic mounts. Data were collected with the DVRT core removed, and with the core at two known physical displacements from the null position. The DVRT, its signal conditioning and its wireless digital transmission circuitry were placed inside an environmental chamber with programmable temperature controller (Thermotron). Data were collected for these conditions at 20, 10, and 0 deg Celsius. From these data, we were able to compute the system offset drift and system span coefficients independently of the linear expansion coefficients of the substrate to which the DVRT’s magnetic mounts were affixed.
To determine the effect that magnetic mounting of the DVRT on a steel substrate may bhave on the thermal coefficients, tests of the DVRT and strain gauge instrumented 4140 steel cantilever beam were also performed. The DVRT and instrumented cantilever beam were placed within the environmental chamber, and their requisite electronics were placed outside of the chamber. This strategy allowed us to focus on the DVRT’s contribution to thermal errors, by direct comparison to the bonded foil strain gauge.
RESULTS
Comparison to Foil Strain Gauge
The magnetic mount DVRT strain gauge’s performance was comparable to that of the conventional bonded foil strain gauge, as shown in Figure 6. The DVRT data are plotted as a function of the strain gauge data, and correlation coefficient (.9978) presented. Note that these data represents several complete cycles at the 20 Hz test frequency. The data indicate minimal hysteresis or phase lag, and the relationship of magnetic mount DVRT data to conventional bonded foil strain gauge data is very nearly linear.
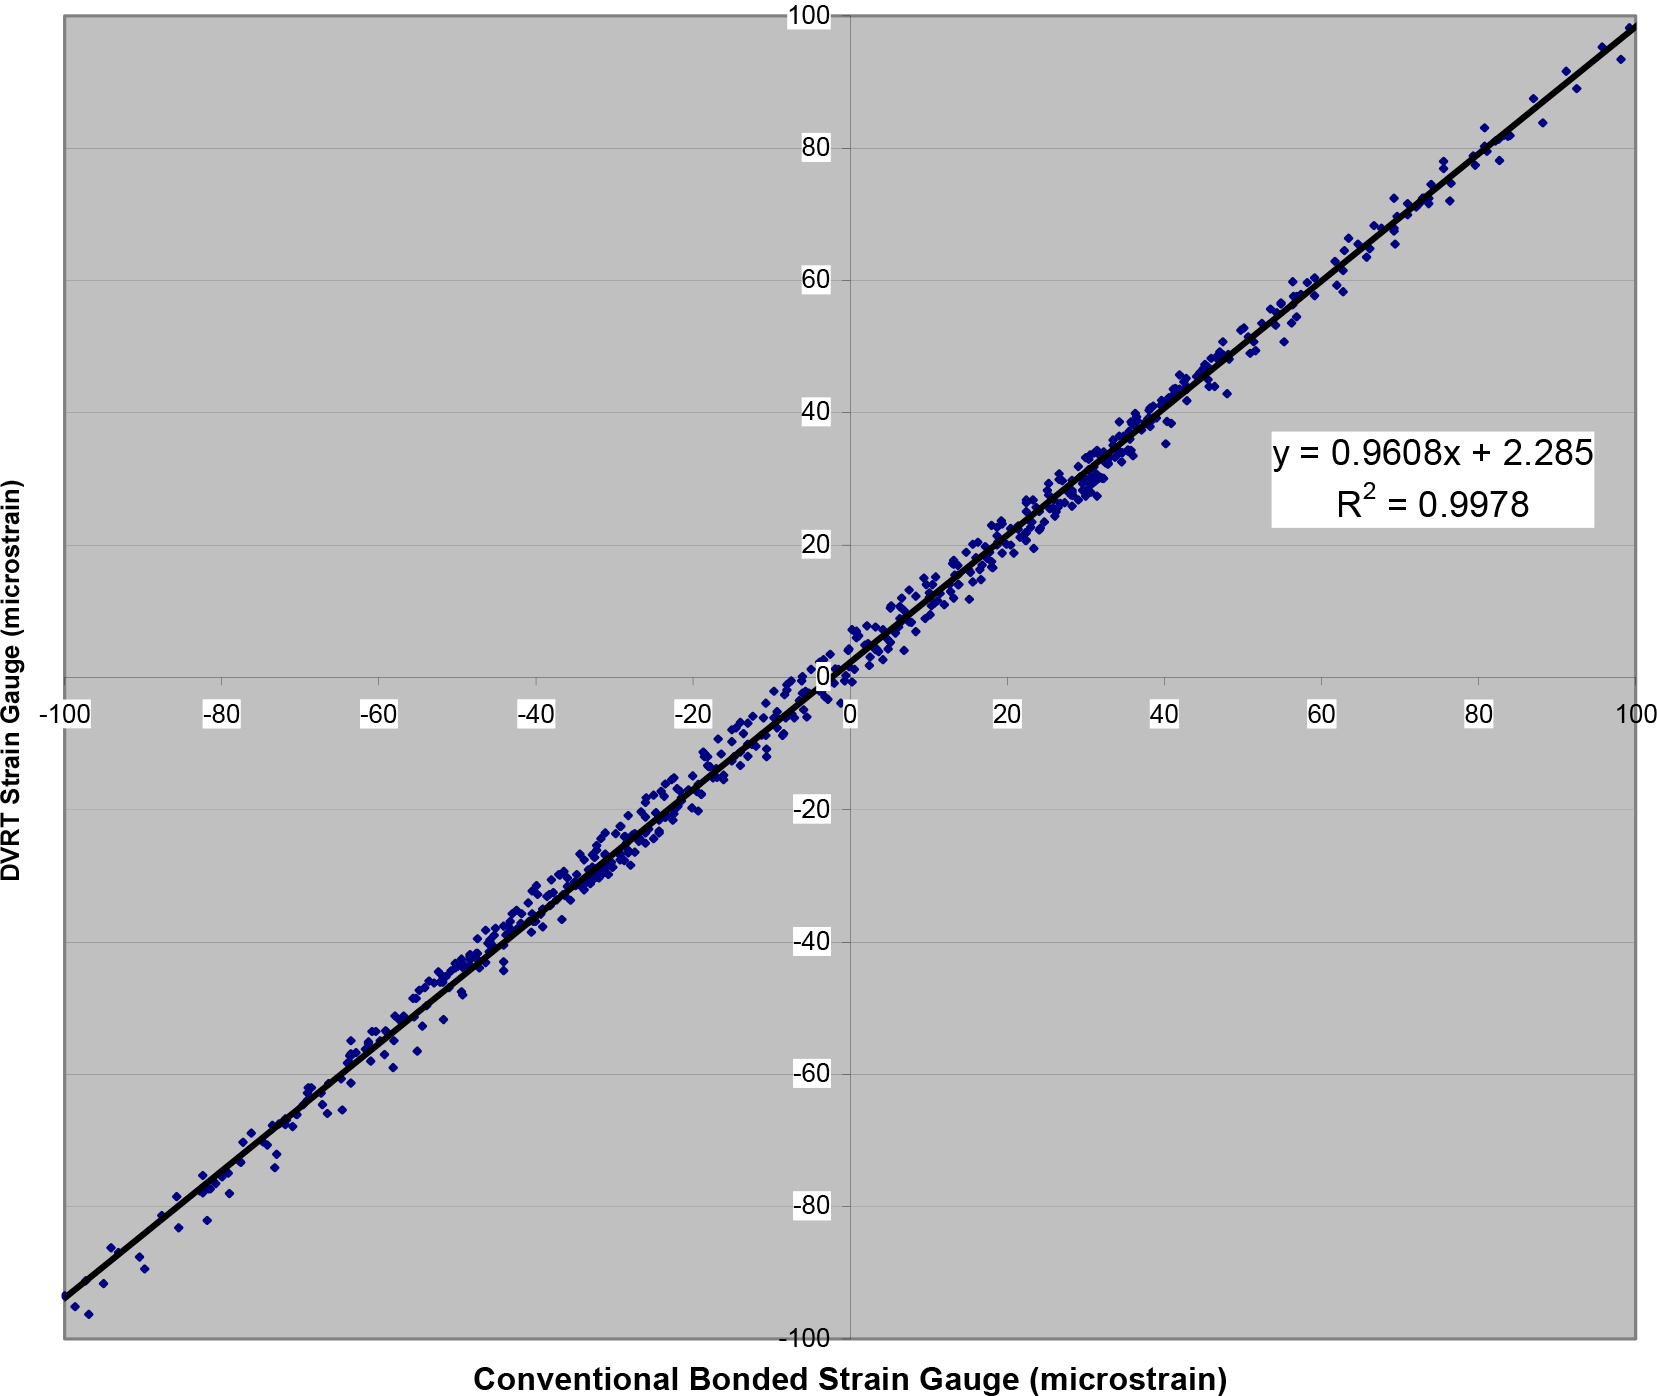
Figure 6. Output of magnetic mount DVRT strain gauge vs. conventional bonded strain gauge
Determination of Temperature Coefficients
The results from the thermal tests of the magnetic mount DVRT, its signal conditioning and its wireless digital transmission circuitry system on an Invar block at various temperatures is plotted below in figure 7. The DVRT output is plotted on the vertical axis, in microstrain, by scaling its displacement output using its calibration coefficient and gauge length (100mm). The horizontal axis represents fixed Presented at 4th Int’l Workshop on Structural Health Monitoring Stanford University, Stanford CA, Sep 15-17, 2003 displacements measured using the DVRT’s output at room temperature. Slopes and offsets were calculated for the three temperatures tested. The temperature coefficient of span was -0.086%/ °C between 20 and 10 degrees Celsius and 0.482% between 10 and 0 degrees Celsius. The offset shifts were 18.7 microstrain per degree Celsius between 20 and 10 degrees Celsius and 14.6 microstrain per degree Celsius between 10 and 0 degrees Celsius. This offset shift may be largely attributed to the core material, which is comprised of hardened 316 stainless steel. The thermal expansion coefficients of this material ranges between 16 and 17.8 microstrain/ degree Celsius (Micro-Measurements, Raleigh, NC).
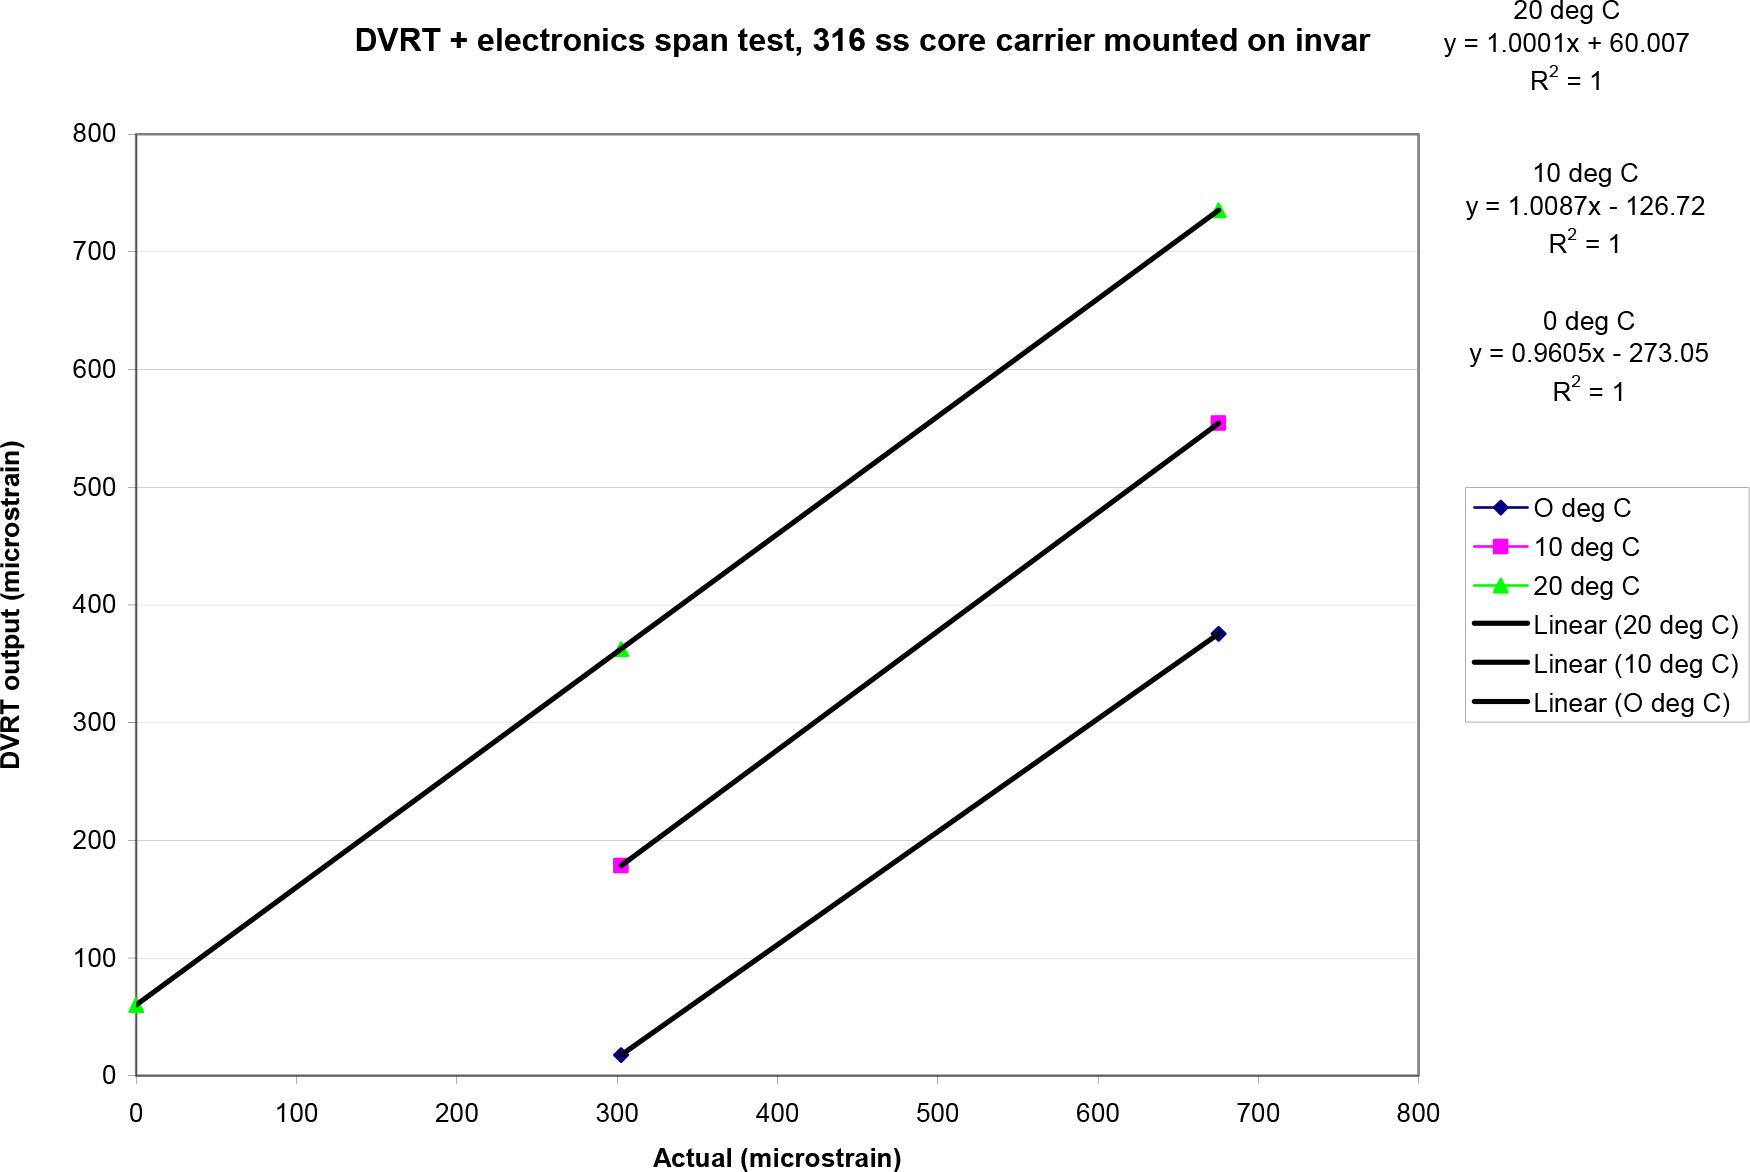
Figure 7. Output of DVRT vs. fixed strain values at various temperatures
The results from the thermal tests of the magnetic mount DVRT and strain gauge instrumented 4140 steel cantilever beam are presented below in figure 8. The DVRT output is plotted on the vertical axis, in microstrain, by scaling its displacement output using its calibration coefficient and gauge length (100mm). In bending an additional scale factor is applied to account for the DVRT’s distance from the neutral axis of the beam which is greater than the surface location of the bonded foil strain gauge. On the horizontal axis we plot the output of the bonded foil strain gauge. A shunt calibration was performed to convert its signals in to units of microstrain. The temperature coefficient of span was 0.0023%/ °C between 22 and 50 degrees Celsius and -0.05% between 22 and 0 degrees Celsius. The offset shifts were -0.76 microstrain per degree Celsius between 50 and 22 degrees Celsius and -1.15 microstrain per degree Celsius between 22 and 0 degrees Celsius.
These results indicate that the DVRT has a relatively low temperature coefficient of span compared to the DVRT with its requisite signal conditioning. Compensation for the signal conditioning span error is warranted. One strategy is to implement an automatic shunt calibration.
The results also indicate that the temperature coefficient of offset is much lower for the DVRT combined with a steel substrate as compared to the DVRT on the Invar substrate. The apparent decrease in offset temperature coefficient on steel may be largely attributed to the linear expansion coefficients of construction steel which is between 10.8 and 12 microstrain per degree C, and begins to approach that of the DVRT stainless steel core. Offset and span errors may be corrected in software by use of an on-board semiconductor temperature sensor (MicroChip model 1046, Chandler, AZ) and an appropriate software correction algorithm which may reside in the remote units microcontroller or may be applied in a post processing routine.
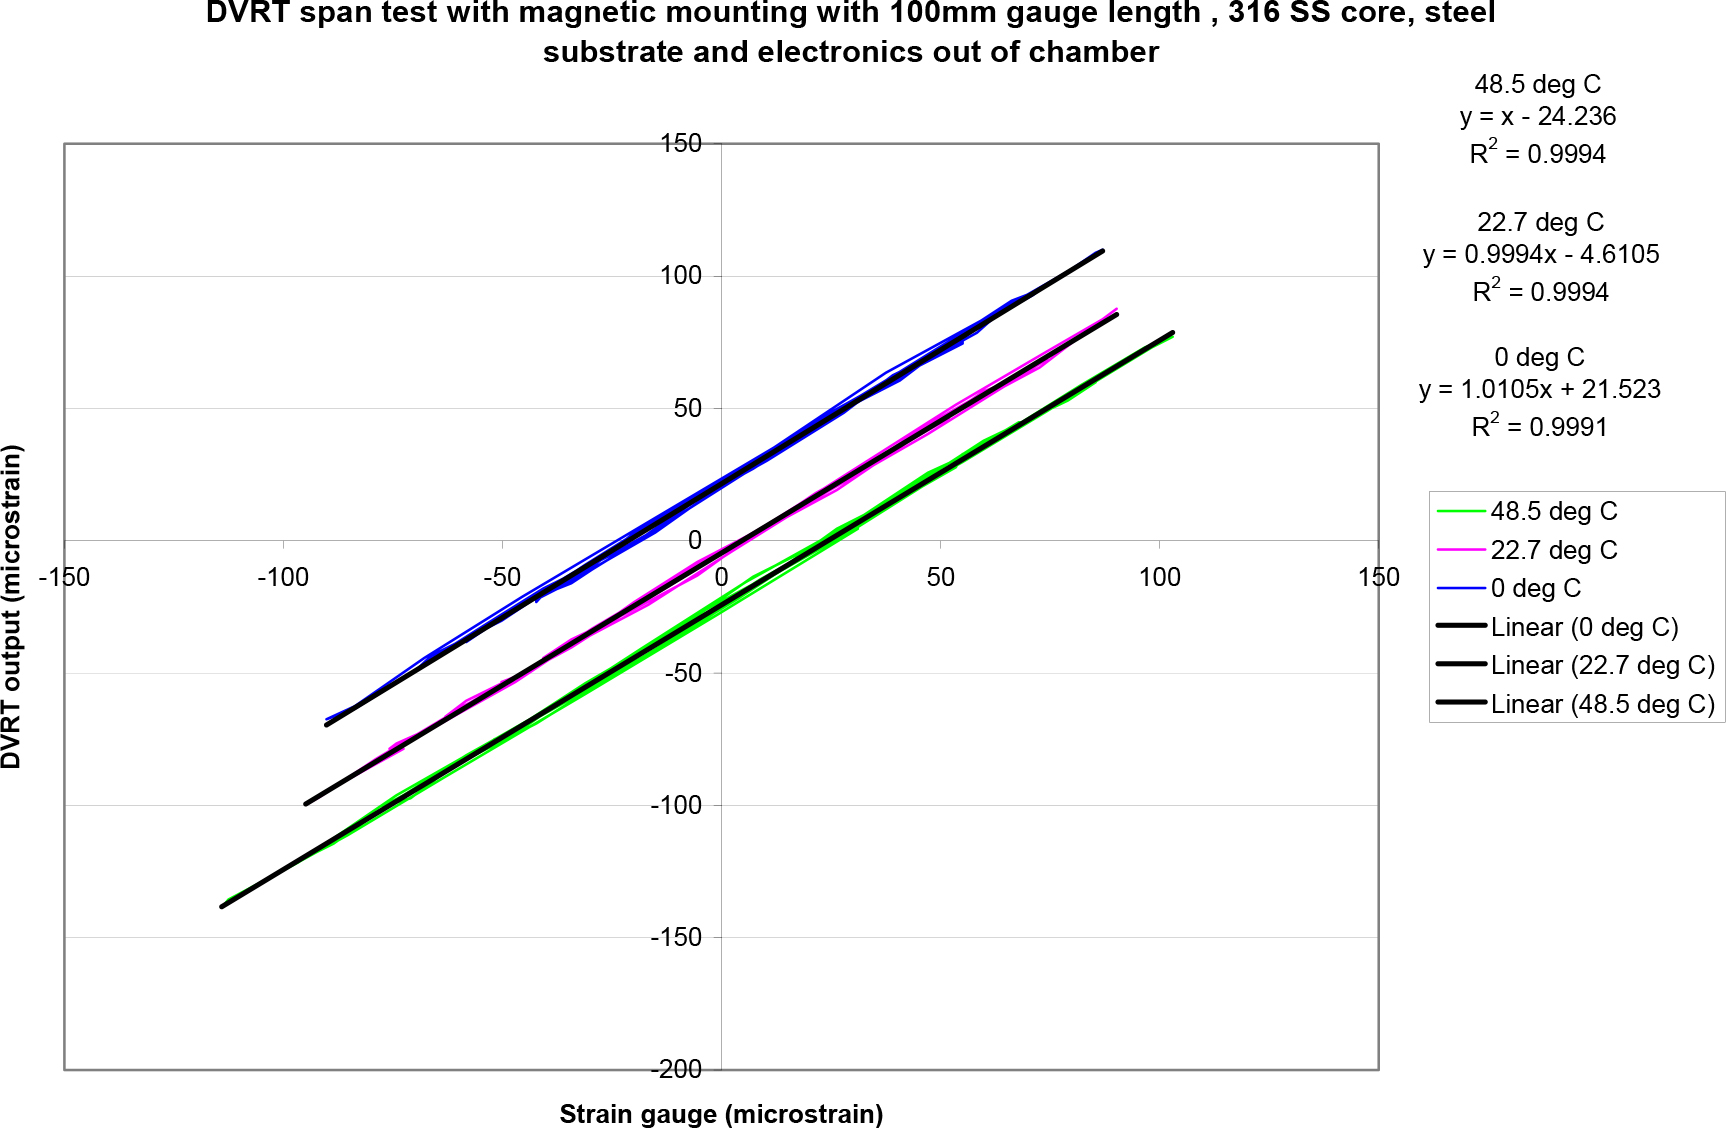
Figure 8. Output of magnetic mount DVRT vs. conventional strain gauge at various temperatures
Field Trials on a Civil Structures
The first field-trial involved placing several datalogging transceiver nodes and magnetic mount DVRT’s on a heavily-trafficked steel girder composite deck bridge spanning the LaPlatte River in Shelburne, VT. The magnetic mount sensors were placed on the bottom flange of the central beam, and also near the bottom of the beam web, as in Figure 3.

Figure 9. Strain data collected during the passage of two large trucks
Installation of each sensor required less than five minutes. The base station was connected to a laptop computer, located approximately 35m away from the sensor nodes. The noise floor measured with no vehicle traffic (+/- 1.5 microstrain) was slightly higher than expected. However, with heavy traffic on the bridge, the system successfully collected and transmitted data. Figure 6 shows data collected while two large trucks traversed the bridge, each traveling in opposite directions.
CONCLUSION
A wireless strain sensor that can be quickly installed, without damaging the target structure has been developed and demonstrated. It can be deployed for long periods of
time, with a collecting strain data at 2 kHz with a resolution of +/-1.5 microstrain. The first field trial was successful. The system is currently undergoing long-term testing to evaluate reliability, drift, and environmental resistance. Enhanced signal conditioners are under development which provides improved thermal stability under harsh operating conditions.
ACKNOWLEDGEMENT
This material is based upon work supported by the National Science Foundation under Grant No. (0078617, 0110217).
REFERENCES:
1. C.P. Townsend, M.J. Hamel, P. Sonntag, B. Trutor, J. Galbreath, and S.W. Arms. 2002. “Scaleable, Wireless Web Enabled Sensor Networks” Sensors for Industry, 2002 Conference.
2. Huston, D. 2001. “Adaptive Sensors and Sensor Networks for Structural Health Monitoring”, Proc. SPIE Complex Adaptive Structures, 4511:203-211.
3. E. Shih, S. Cho, N. Ickes, R. Min, A. Sinha, A Wang, and A. Chandraskan. 2001. “Physical layer driven protocol and algorithm design for energy-efficient wireless sensor networks,” The Seventh
Annual International Conference on Mobile Computing and Networking. 272-287.
4. Hartog, J.P. 1985. Mechanical Vibrations, Dover Edition. McGraw-Hill, New York, pp. 63-64.
5. D. C. Guzik, C.P. Townsend, S.W. Arms. 1998. “Microminiature High-resolution Linear Displacement Sensor for Peak Strain Detection in Smart Structures”, Proc. SPIE Smart Structures and Materials, 3330:30-35.
Per maggiori informazioni contattaci: https://www.lunitek.it/contatta-sensoristica-e-acquisizione-dati/