LUNITEK – Soluzione IoT per il Monitoraggio e il preallarme degli spostamenti

LUNITEK – Soluzione IoT per il Monitoraggio e il preallarme degli spostamenti

GEA SYSTEM – IoT solution for monitoring and early-warning of displacements

Based on:

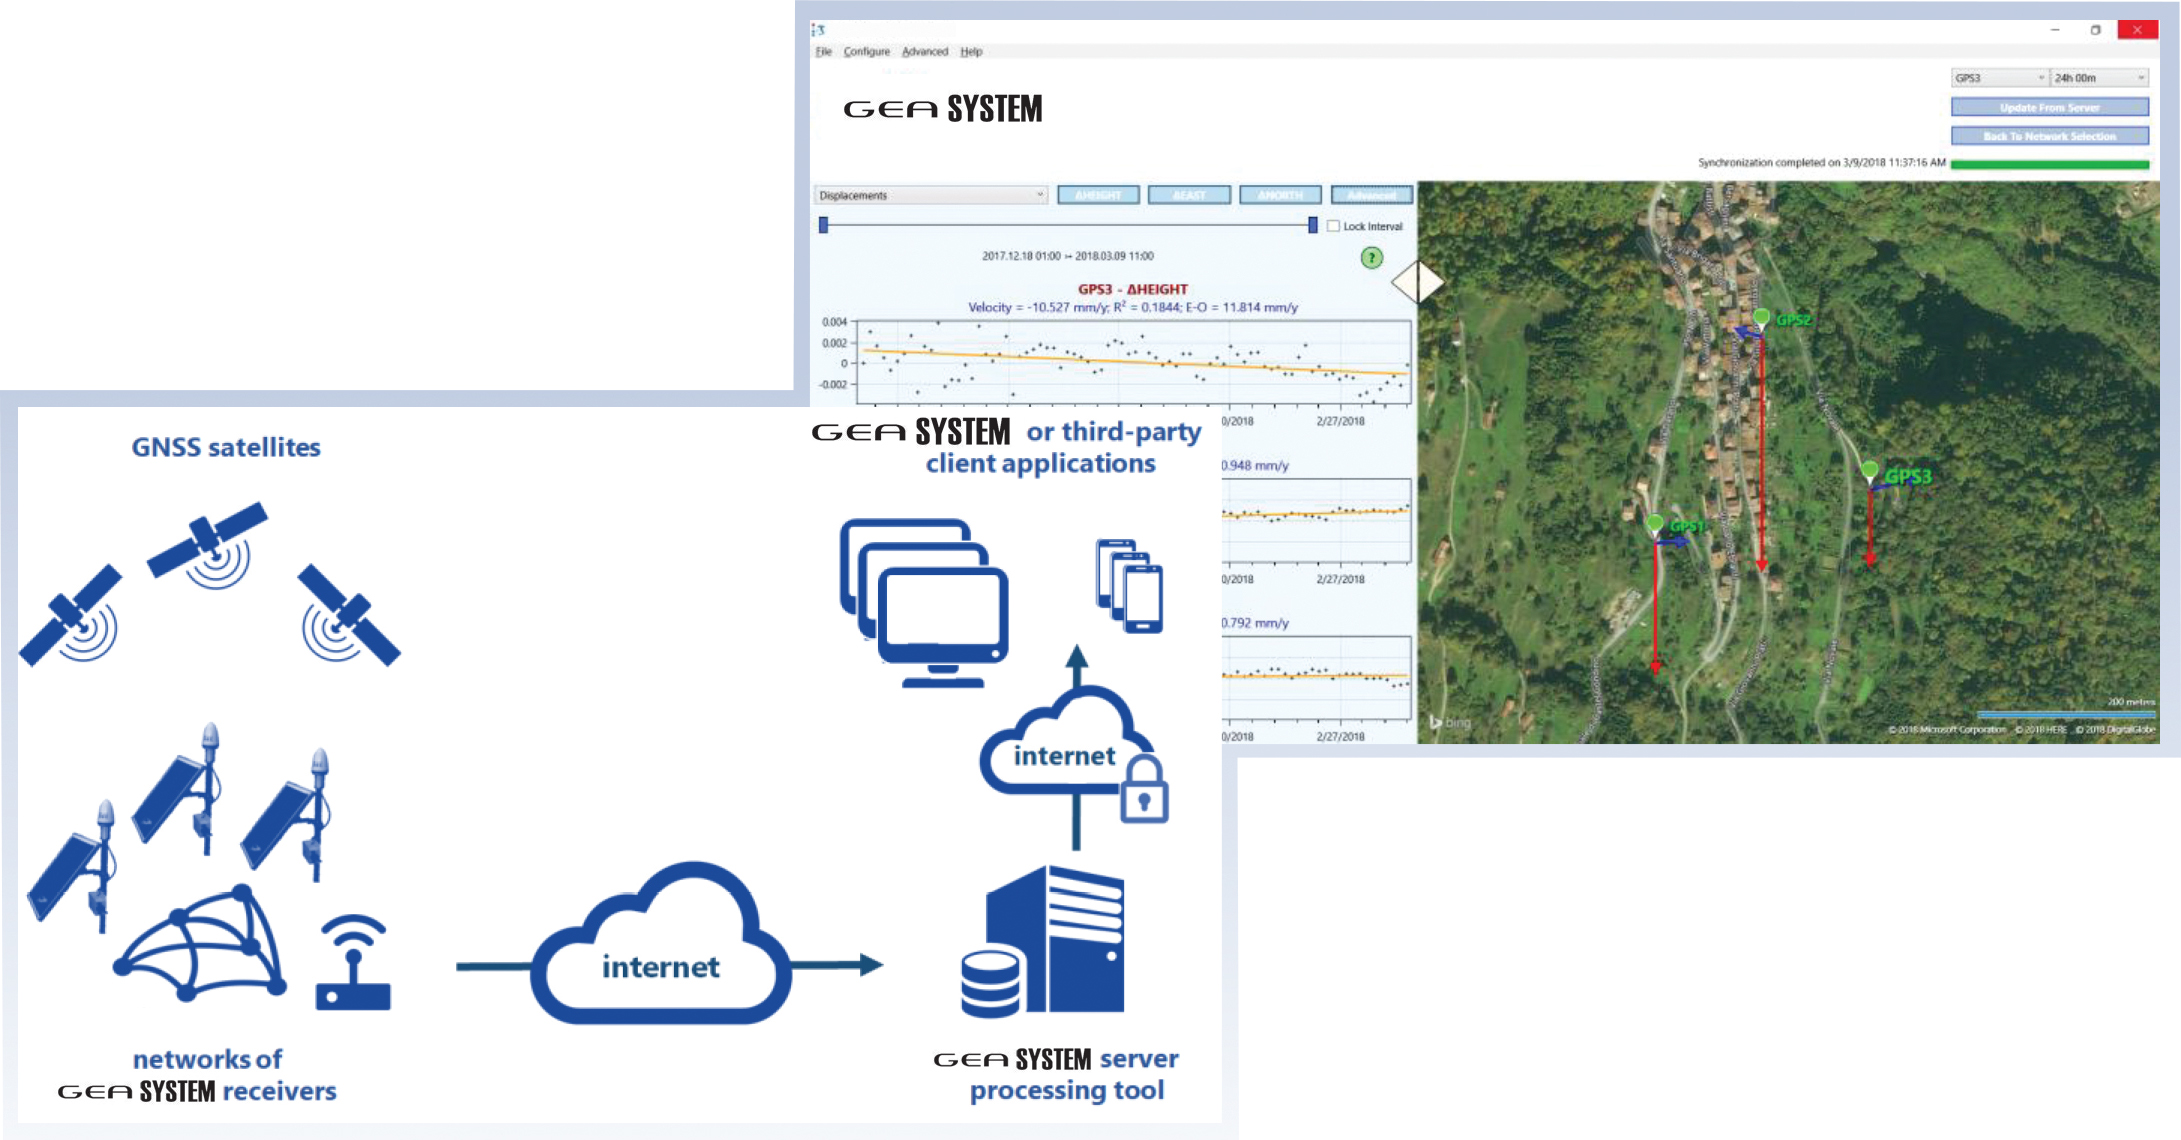
  • Networks of GNSS L1 low-budget sensors
  • 3-D displacements with millimetre level repeatability


Application fields:

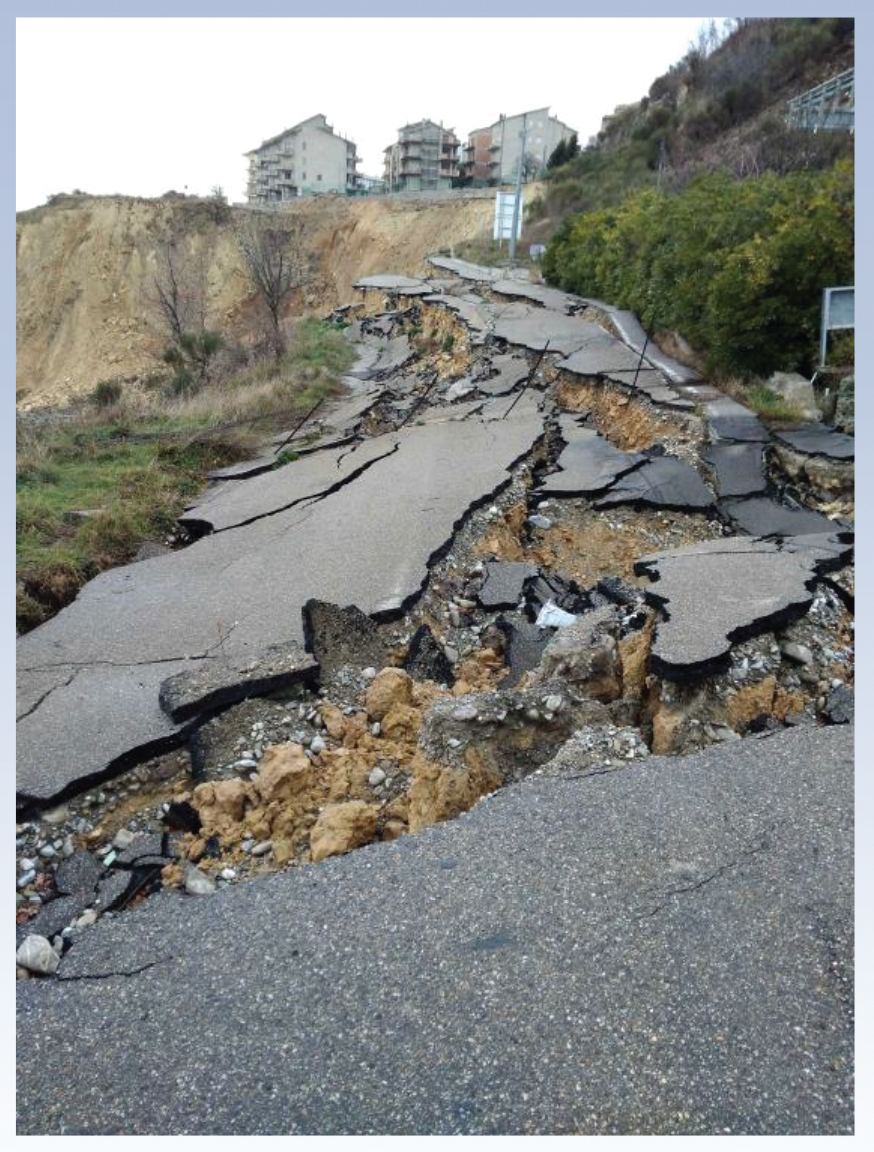
  • Landslides, subsidence, co-seismic deformations
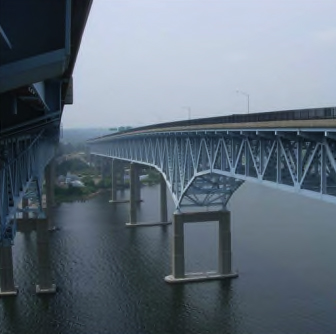
  • Critical infrastructures
  • Deformations due to human
    • Activities: Excavations, injection/extraction of natural gas


Features:

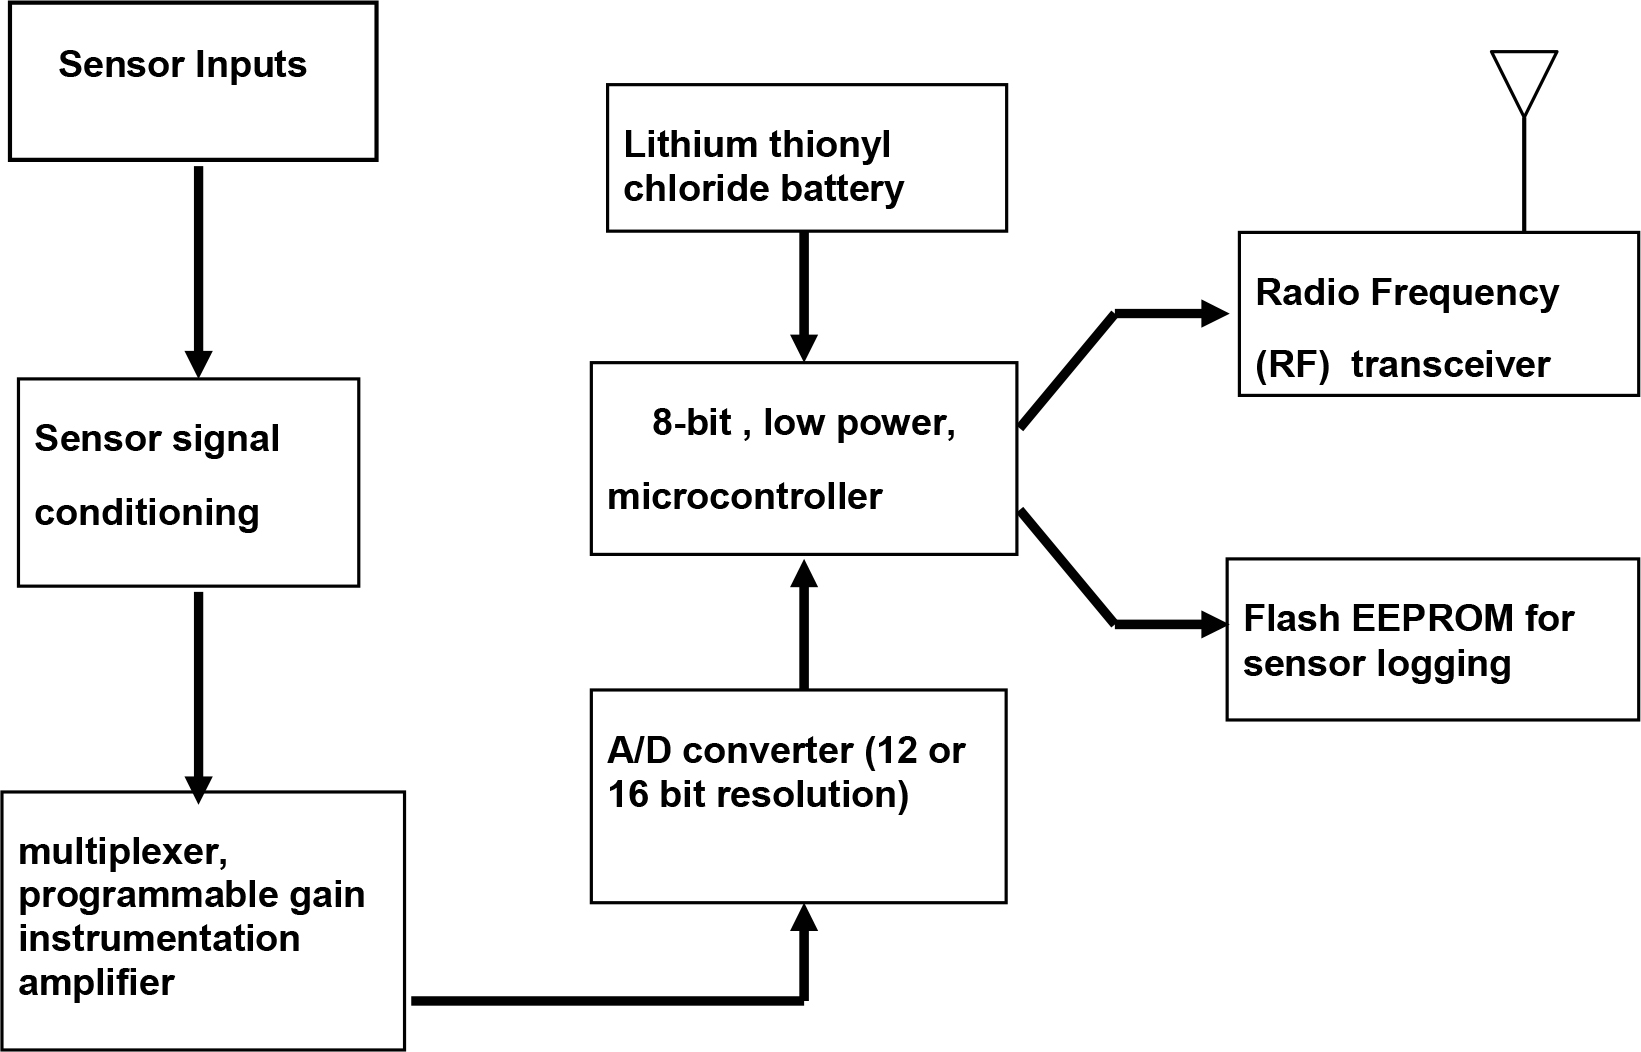
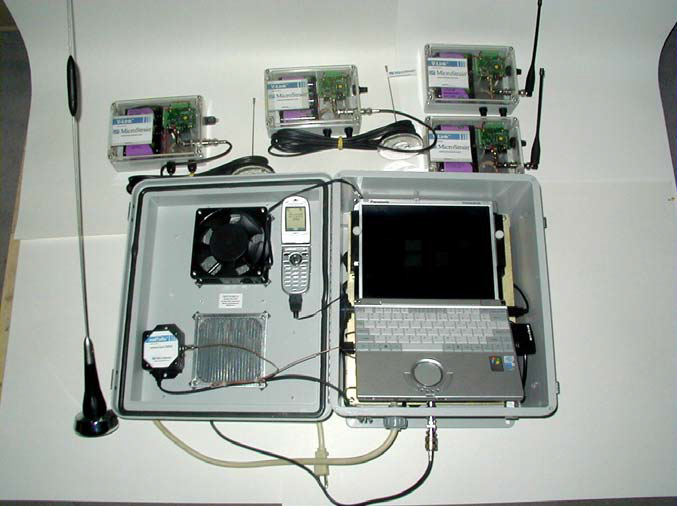
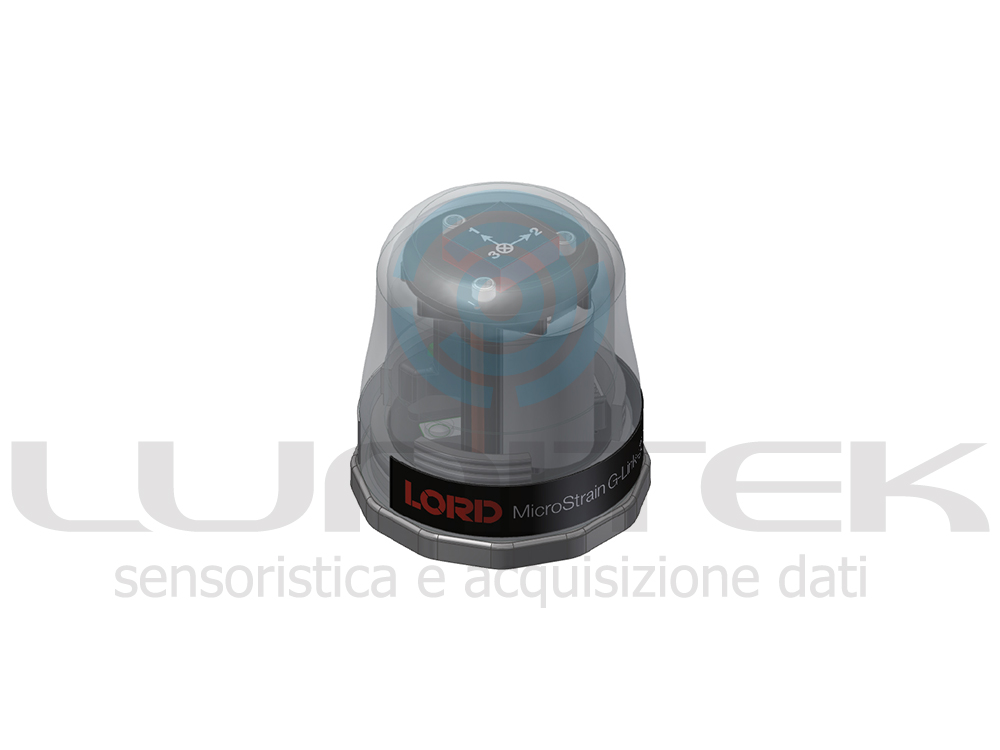
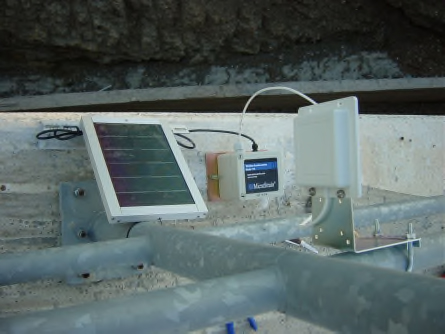
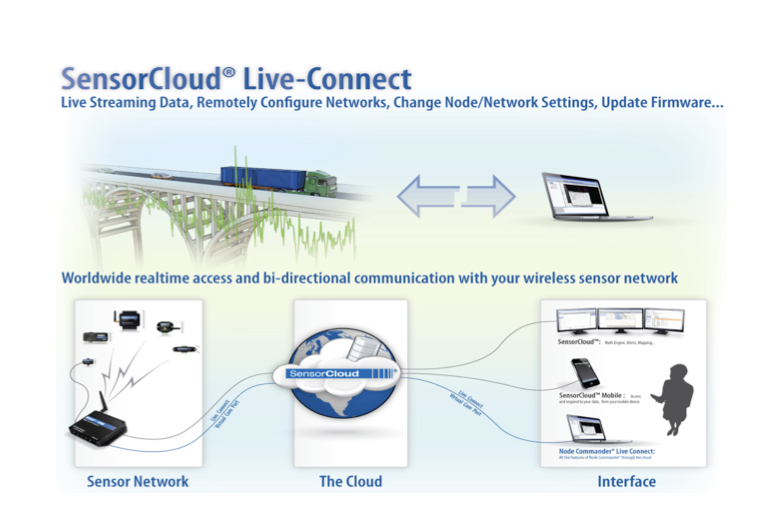
  • GEASYSTEM nodes are composed of lightweight, compact, low energy consumption, single-frequency GNSS stations, power supply modules based on photovoltaic panels and 868 MHz wireless interfaces for the transmission of data
  • Receivers installed at a monitoring site form wireless mesh networks, transmitting in real-time GNSS raw observations and telemetry data to a gateway node, equipped with internet connectivity. Network data are collected at a server where a specific SW computes displacements with millimeter level repeatability
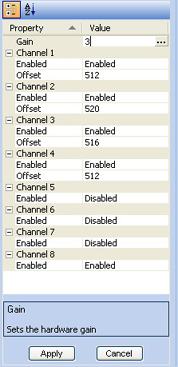
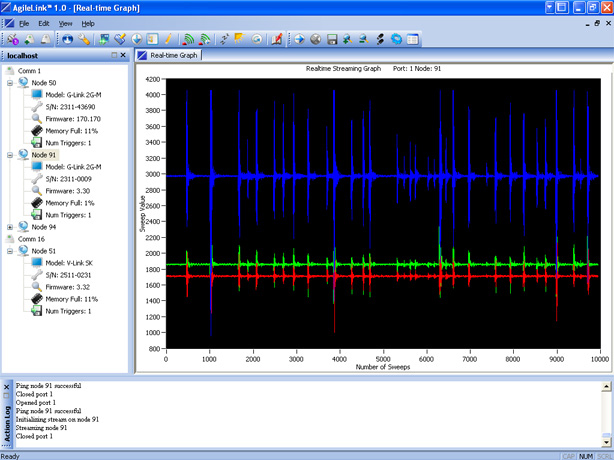
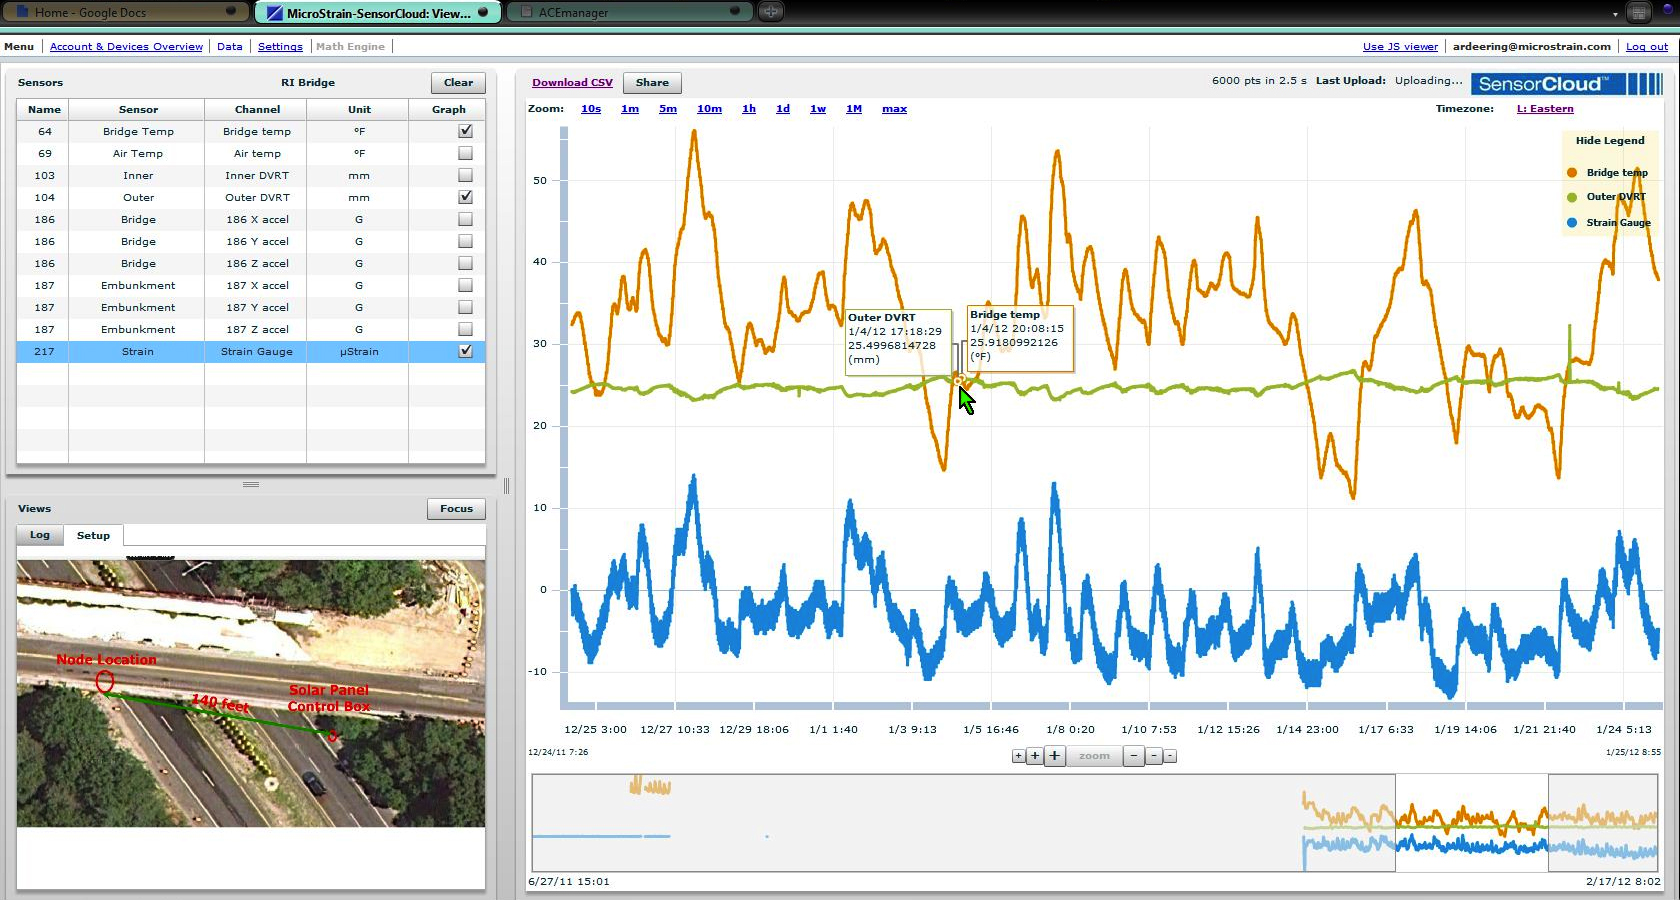
  • A dedicated dashboard (client application) allows the User to display data on a map and on graphics with time series of 3-D displacements and telemetry data
  • GEASYSTEM can be configured to send alert e-mail in case of system malfunctions or when specific User defined displacements thresholds are exceeded, thus allowing forecasting of possible dangerous events
  • Publication of displacements and telemetry data is made through REST web services allowing the integration of measurements in pre-existing and
    custom dashboards


HARDWARE SPECIFICATIONS

GNSS
Receiver: U-BLOX M8T
Antenna: MOBI MBGPS GNS-30-001; frequency range 1575.42±10 MHz; gain 30±3 dBi; SMA female connector; 3.3V (different options on request)


WIRELESS CONNECTION
Type: 868 Mhz, link wireless 0.5W. TDMA proprietary transmission protocol
Antenna: Directional gain 13dBi or omni-directional gain 3dBi; SMA female connector; 3.3V (different options on request)
Range: 8 km LoS
Networking: Up to 14 nodes connected to a single gateway; mesh network; each node can be configured as node or gateway by the User


POWER
Photovoltaic panel: 20Wp (optional 50Wp)
Battery: 12V 12Ah (144Wh); charge from -15 to 50 Celsius
Autonomy: Potentially unlimited (considering 2 hours of sunlight per day – 20Wp panel); a fully charged battery at 20 Celsius can power up the station for more than 12 days in case of total dark
Power consumption: < 390mW on average (including antenna)


OTHER
Protection: IP65
Dimensions: GNSS Unit 17x10x5.5 cm

GNSS Antenna 8×13 cm

Photovoltaic panel (20Wp): 34x50x2.4 cm

Wireless antenna (Yagi): +13dBi Whip. 63×18 cm


DISPLACEMENTS CALCULATION SOFTWARE


GEASYSTEM GNSS CORE
Programming language: C and C++
3rd party libraries: RTKLIB (v. 2.4.2, BSD-2 license); used for GNSS data reading and clocks syncronization
Processing: Proprietary double-differences batch least square estimator developed to reach maximum performances in term of displacements repeatability for static monitoring applications
Repeatability: From 1 to 3 mm RMS for 24 hours batch of data (according to distance and height difference between reference and rover and to satellite visibility and possible multipath)


Per maggiori informazioni contattaci: https://www.lunitek.it/contatta-sensoristica-e-acquisizione-dati/

Settembre 7, 2018 / by / in
LUNITEK – ASCLEPIUS Software per il monitoraggio e la valutazione dei danni strutturali

ASCLEPIUS – Software per il monitoraggio e la valutazione dei danni strutturali

The software ASCLEPIUS is developed by:


Why should I monitor the health status of my building?

A real-time system monitoring the vibrational characteristics of a structure allows to detect potential damage at the earliest possible stage, bringing considerably benefits and increasing the safety of the occupant.

The reliability of the results is ensured both by the ad hoc sensors disposition and the calibrated calculation model, in which all the very own structural features of the building are taken into account.


Structural health monitoring: How does it work?

The use of sensors having high dinamyc range and low noise level, if combined with an advanced and dedicated software for signal processing and structural identification, guarantees the knowledge of the health status of the building in the strong motion phase as well as in its serviceability condition before and after a seismic event.

The software is in constant communication with the sensors, elaborating the signals in near-real-time and periodically extracting the modal parameters of the structure. These parameters can be considered like a «fingerprint» of the building and their changes over time can be used for an effective damage assessment. Each system is specifically calibrated on the related structure, in terms of both hardware (number of sensors and disposition) and software (implemented calculation model) in order to guarantee the reliability of the results.


Periodical dynamic identification from ambient vibration

During the regular serviceability condition of the structure, ambient vibration measurements are acquired several times a day. Once signals are sent to the monitoring software, a dynamic identification analysis is performed through automatic algorithms that use the Operational Modal Analysis (OMA) techniques in order to estimate natural frequencies (w), mode shapes (A) and damping (n) of the building under its operating conditions.

Figure 1. Cross-spectrum


Figure 2. System architecture


The methods for damage assessment that examine the changes in the vibration characteristics follow the basic idea that modal parameters depend on the physical properties of the structure. When a significant variation (Delta w) in the identified characteristics is detected, suggesting the occurrence of a potential damage in the structure, an automatic procedure is started to apply some damage identification methods by analysing the differences between the last modal characteristics and the last reference ones, assumed to represent the undamaged state of the structure.

Figure 3. Time-frequency analysis


Identified parameters can also be used to calibrate a FE model of the building through Model Updating techniques, to make the model as closely as possible to the reality.


Real-time strong motion monitoring

During the seismic event, the system acquires the signal recorded by sensors placed on the ground outside the building, that are designed to provide the main strong motion parameters for the considered earthquake, i.e. Peak Ground Acceleration (PGA), Peak Ground Velocity (PGV), Peak Ground Displacement (PGD), Arias Intensity (AI) and Significant Duration (SD).
At the same time, the software acquires the signals of the sensors located on the structure in order to calculate the real time displacements and related inter-story drift ratios (IDRs) that occurred during the seismic event. As the IDR is one of the parameters that is mostly related to the structural damage, the software can instantly give a warning about a potential damage occurrence, using specific capacity curves that correlates the IDR values with the expected level ofdamage in the structure.

Figure 4. Real time recorded channels


During a seismic event, the deformations induced in the building result in a reduction of its natural frequencies, due to the nonlinearities in the material response. If no structural damage has occurred this frequency drop tends to be recovered as soon as the earthquake ends.
The monitoring software uses time-variant AutoRegressive exogenous (ARX) models in order to carry out a time frequency analysis, identifying the frequency drop during the event. Monitoring the way in which the structure modifies its vibrational characteristics during a seismic event can be useful in the cumulate damage estimation.


Per maggiori informazioni contattaci: https://www.lunitek.it/contatta-sensoristica-e-acquisizione-dati/


Settembre 6, 2018 / by / in
LORD MICROSTRAIN – Reti di sensori wireless ad alta velocità per il Monitoraggio della deformazione delle strutture con efficienza energetica

Civil Structure Strain Monitoring with Power-Efficient, High-Speed Wireless Sensor Networks

J.H. Galbreath*, C.P. Townsend*, S.W. Mundell*, M.J. Hamel*,
B. Esser^, D. Huston, Ph.D.^, S.W. Arms*

Abstract

The goal of this work is to develop and deploy a network of long life, low-cost wireless strain sensors to monitor civil structures. Previous work on RF sensor nodes which transmit periodically to a central receiver using time division multiple access (TDMA) has been reported [1]. With a low power sleep mode and 30 minute sampling interval, this system is estimated to operate for 5 years on one 3.6V Li-Ion AA battery.

However, deployment of the TDMA system on structures underscored the need for a high-speed wireless sensor network with user-triggered and event-triggered data streaming capabilities. To this end, this prompted the development of a second generation datalogging transceiver (75 Kbps , 2MB memory). These systems provide 1KHz, 3-channel data in continuous streaming mode or 2KHz, 3-channel data in data logging mode. The node preserves battery life by entering a low power sleep state. The node periodically awakens and listens for commands, or wakes via eventtriggered interrupt.

This high-speed system was installed on a heavily trafficked bridge in Vermont. Displacement sensors were attached to steel girders for static and dynamic strain measurement. Strain data were acquired via a wireless link. The wireless system is designed to remain long term on the bridge for interrogation under normal and controlled operating conditions.

Author Affiliations Key:
* MicroStrain, Inc., 310 Hurricane Lane, Suite 4, Williston, VT USA 05495 U.S.A.
e-mail: contact@microstrain.com web site: www.microstrain.com
^ University of Vermont, Dept. Of Civil & Mechanical Engineering, Burlington, VT USA 05405

Introduction

Aging civil infrastructure presents a need for an inexpensive, easy to install strain monitoring system [2]. Servicing and installation can form a large portion of the expense of such a system, since human access to civil structures often requires specialized equipment, liability insurance, and vehicle traffic control. Hard-wired systems increase this human access component, with the system distributed over a larger area on the structure. In contrast, a wireless strain monitoring system as shown in Figure 1, only requires access to desired measurement areas, reducing the human access component, and ultimately reducing the cost of implementation.

Objectives

The primary research goals were divided into two categories. The first objective was to build a second-generation, high-speed wireless sensor network, based on a new datalogging transceiver platform. This platform adhered to the following design criteria: 1) high speed wireless sensor streaming 2) minimal, deterministic streaming latency 3) onboard, non-volatile, high capacity data logging 4) advanced sleep modes for long-term deployment 5) interfaces with quarter, half, and full bridge sensors 6) interfaces with magnetic mount DVRT displacement sensors.

Figure 1. Network of wireless strain sensors, deployed on bridge structure

The second objective was to design a magnetic-mount attachment method for a high-resolution DVRT (differential variable reluctance transducer). The DVRT magnetic mount design would adhere to the following design criteria: 1) simple to attach to steel structures 2) no harm to surface of target structure 3) rugged construction for extended field use 4) highly resistant to slipping or migration due to ambient loads, such as vibrations.

METHODOLOGY

Data Logging Transceiver Architecture

The datalogging transceiver platform was developed from off-the-shelf components, relying on IC’s (integrated circuits) for miniaturization and cost reduction. Figure 2 is a block diagram schematic. The platform has 8 channels of analog input. Channels one through four feature amplified full-differential input, with software programmable gain and offset, with optional bridge excitation and completion for interfacing full, half, or quarter bridge sensors, such as strain gauges and load cells. Channels five through seven provide non-amplified pseudo-differential input, accepting analog voltages between 0 and 3 volts. The last channel is reserved for an onboard solid-state temperature sensor (TC1046, MicroChip Technologies, Chandler AZ). The platform also features three 12-bit digital to analog converters that enable wireless bi-directional control applications.

At the heart of the wireless sensor is a low power 8-bit micro-controller (PIC16F877, MicroChip Technologies) that collects sensor data via an 8-channel, 12- bit successive approximation A/D converter (MCP3208, MicroChip Technologies). This data can then be stored locally to an onboard 2MB flash memory chip (AT45DB41, Atmel Corporation, San Jose CA), or streamed wirelessly. If the latter collection method is chosen, a half-duplex, narrowband ASK transceiver (DR-3000-1 RF Monolithics, Dallas TX) sends the sensor data at 75 Kbps, over a 916.5 MHz carrier.

Figure 2. Datalogging transceiver block diagram

TABLE I. SAMPLE RATE VS. NUMBER OF ACTIVE CHANNELS

On the user/controller-end, a base-station with the same telemetry hardware receives the incoming data stream, and forwards the data to a PC via a standard RS- 232 serial port. Since the telemetry hardware is bi-directional, the base station can also send commands and data to the remote nodes. This allows the user to reconfigure the operational parameters of the nodes wirelessly, and trigger data collection sessions. The network topology was implemented as a single-hop, hierarchical model, capable of supporting hundreds of nodes per base-station. Combined with the welldefined behavior of the narrowband RF transceiver, the topology enabled a minimal and deterministic sensor streaming latency. The system latency was measured to be less than 2 ms by measuring the time between an A/D sample on the remote node, and reception of this data on the serial port of a PC.

Wireless sensor streaming occurs at a fixed rate of 75 Kbps, which allows for approximately 1700 data points per second, depending on the number of active channels. This relationship is shown in Table 1. Error detection is accomplished with a checksum byte for each sweep (defined as a frame containing a sample of each active channel). This error detection scheme was chosen due to its low overhead requirements, which allowed for greater data throughput.

Datalogging occurs at one of seven user-selected sample rates between 32 Hz and 2048 Hz. This is a sweep rate, covering all active channels, with a maximum aggregate bandwidth of 16,384 data points per seconds (when all eight channels are selected). This information is stored on a 2 megabyte, non-volatile flash memory chip. Since access to civil structures can be limited, battery life was one of the most important design considerations for the datalogging transceiver. RF communications often dominate energy consumption in wireless sensing applications [3], so it was
important to develop a communications protocol that minimizes radio usage on the remote node. Table 2 lists the power requirements of the wireless sensor. (All measurements are taken when interfaced to a single 1000-ohm full bridge strain gauge sensor).

It was also important to implement intelligent sleep states, since the nodes would remain on the bridge for large periods of time without user-interaction. The microcontroller on the remote node features a low power sleep mode that can be exited via a watch-dog timer, or an external interrupt. This enabled two low-power monitoring modes.

TABLE II. REMOTE NODE POWER REQUIREMENTS

In the first mode, the microcontroller periodically awakes via a watchdog timer interrupt, turns on the telemetry hardware, and listens for a wake command from the base station. If it does not detect a wake command within 50msec, it returns to the same sleep mode. In the second mode, the microcontroller remains in the low power sleep mode until a rising external analog voltage triggers a hardware interrupt.

For the first anticipated test application (scheduled monitoring of strain on a bridge), the following design assumptions were used to estimate battery life. The bridge is to be inspected once a month, requiring that the remote nodes collect data for approximately two hours per session. In addition, the nodes would need to remain in standby mode for six hours during these twelve scheduled inspections. Based on these requirements, the nodes were equipped with a 3.6V, 19 amp-hour, lithium thionylchloride battery (D-Cell, Tadiran Lithium Batteries, Port Washington, NY) which should last an estimated three and a half years.

Magnetic Mount DVRT Strain Sensor

Following consultation with the bridge owners (Vermont Agency of Transportation) it was determined that no epoxy, welds or other permanent fixtures be used to attach the strain sensors. These constraints led to the development of rapidly attachable compliant sensor that does not alter or permanently bond to the steel. The design used a magnetically-attached ultra-high resolution DVRT displacement sensor. Variable reluctance transducers have been used successfully in both large scale [4] and high resolution strain measurements [5]. For this application, the transducer uses two
neodymium magnets for attachment. The magnets are shielded from the sensor by a 416 stainless steel cup. This cup concentrates the flux lines and increases the holding power to about 45 N.

Figure 3. Magnetic Mount DVRT Sensors

The chosen displacement transducer is a DVRT (NANO-DVRT, MicroStrain, Williston VT) and inline signal conditioner (DC-DEMOD, MicroStrain). This sensor is capable of linear displacement measurements with a resolution of 10 nanometers. As shown in Figure 3, each DVRT sensor required two magnetic mount blocks to attach to the target structure. The body of the sensor was mounted within one block and the ferrous core was mounted to the other block with a 100 mm long rod. The configuration results in a strain sensor with a gauge length of 100 mm. In this
configuration, one microstrain experienced over the 100 mm of substrate corresponded to 100 nanometers of core displacement. A machined aluminum spacing jig was used as an installation tool that guaranteed consistent spacing and angular alignment while allowing the core to slide freely, Figure 4.

For long-term stability, the attachments between the sensors and the steel beam must remain in permanent contact with no relative motion at the contact pads. The shear force resistance of the attachments was tested by applying a shear load with a calibrated “S” type load cell (Model 363, Revere Transducers, Tustin CA) and reading the DVRT output. When the applied shear load is high enough to move the attachment pad, the DVRT core begins to move within the sensor and is detected. Multiple types of changes in the interface between the metal attachment and the substrate were also tested, with the idea that a high friction interface would make the magnetic attachments hold even better. A diamond knurl pattern was machined directly onto the base of the stainless steel attachment. This knurl pattern significantly increased the coefficient of friction between the attachment and the substrate under test, and the reactive force was increased from approximately 9 Newtons to about 13 Newtons. This design was deemed to be the best candidate for use in field-deployable sensors.


Figure 4. Magnetic Mount DVRT Sensor Installation

Test Methods to compare DVRT with Conventional Foil Strain Gauge

Data were collected with both a magnetic mount DVRT sensor and a half bridge bonded foil strain gauge (1000 Ohms, Micro-Measurements, Raleigh, NC) mounted on a cantilevered steel beam (5.08cm x 0.64 cm, constant cross section). The beam was resonant in bending at ~20 Hz. To initiate a test, the beam was flexed and then released, creating a cyclic bending strain which exponentially decayed. The strain levels were approximately +/- 200 microstrain (peak-to-peak). Analog voltages from the DVRT signal conditioning and the strain gauge conditioner were recorded by a digital storage oscilloscope. Figure 5 is photograph of this test setup.

Figure 5. Magnetic Mount DVRT and Bonded Foil Strain Gauge on Steel Beam

Test Methods to Determine Temperature Coefficients

To determine the offset and span coefficients of the DVRT strain gauge, two test methods were employed. The first utilized an Invar block, to which the DVRT was affixed with magnetic mounts. Data were collected with the DVRT core removed, and with the core at two known physical displacements from the null position. The DVRT, its signal conditioning and its wireless digital transmission circuitry were placed inside an environmental chamber with programmable temperature controller (Thermotron). Data were collected for these conditions at 20, 10, and 0 deg Celsius. From these data, we were able to compute the system offset drift and system span coefficients independently of the linear expansion coefficients of the substrate to which the DVRT’s magnetic mounts were affixed.

To determine the effect that magnetic mounting of the DVRT on a steel substrate may bhave on the thermal coefficients, tests of the DVRT and strain gauge instrumented 4140 steel cantilever beam were also performed. The DVRT and instrumented cantilever beam were placed within the environmental chamber, and their requisite electronics were placed outside of the chamber. This strategy allowed us to focus on the DVRT’s contribution to thermal errors, by direct comparison to the bonded foil strain gauge.

RESULTS

Comparison to Foil Strain Gauge

The magnetic mount DVRT strain gauge’s performance was comparable to that of the conventional bonded foil strain gauge, as shown in Figure 6. The DVRT data are plotted as a function of the strain gauge data, and correlation coefficient (.9978) presented. Note that these data represents several complete cycles at the 20 Hz test frequency. The data indicate minimal hysteresis or phase lag, and the relationship of magnetic mount DVRT data to conventional bonded foil strain gauge data is very nearly linear.

Figure 6. Output of magnetic mount DVRT strain gauge vs. conventional bonded strain gauge

Determination of Temperature Coefficients

The results from the thermal tests of the magnetic mount DVRT, its signal conditioning and its wireless digital transmission circuitry system on an Invar block at various temperatures is plotted below in figure 7. The DVRT output is plotted on the vertical axis, in microstrain, by scaling its displacement output using its calibration coefficient and gauge length (100mm). The horizontal axis represents fixed Presented at 4th Int’l Workshop on Structural Health Monitoring Stanford University, Stanford CA, Sep 15-17, 2003 displacements measured using the DVRT’s output at room temperature. Slopes and offsets were calculated for the three temperatures tested. The temperature coefficient of span was -0.086%/ °C between 20 and 10 degrees Celsius and 0.482% between 10 and 0 degrees Celsius. The offset shifts were 18.7 microstrain per degree Celsius between 20 and 10 degrees Celsius and 14.6 microstrain per degree Celsius between 10 and 0 degrees Celsius. This offset shift may be largely attributed to the core material, which is comprised of hardened 316 stainless steel. The thermal expansion coefficients of this material ranges between 16 and 17.8 microstrain/ degree Celsius (Micro-Measurements, Raleigh, NC).

Figure 7. Output of DVRT vs. fixed strain values at various temperatures

The results from the thermal tests of the magnetic mount DVRT and strain gauge instrumented 4140 steel cantilever beam are presented below in figure 8. The DVRT output is plotted on the vertical axis, in microstrain, by scaling its displacement output using its calibration coefficient and gauge length (100mm). In bending an additional scale factor is applied to account for the DVRT’s distance from the neutral axis of the beam which is greater than the surface location of the bonded foil strain gauge. On the horizontal axis we plot the output of the bonded foil strain gauge. A shunt calibration was performed to convert its signals in to units of microstrain. The temperature coefficient of span was 0.0023%/ °C between 22 and 50 degrees Celsius and -0.05% between 22 and 0 degrees Celsius. The offset shifts were -0.76 microstrain per degree Celsius between 50 and 22 degrees Celsius and -1.15 microstrain per degree Celsius between 22 and 0 degrees Celsius.

These results indicate that the DVRT has a relatively low temperature coefficient of span compared to the DVRT with its requisite signal conditioning. Compensation for the signal conditioning span error is warranted. One strategy is to implement an automatic shunt calibration.

The results also indicate that the temperature coefficient of offset is much lower for the DVRT combined with a steel substrate as compared to the DVRT on the Invar substrate. The apparent decrease in offset temperature coefficient on steel may be largely attributed to the linear expansion coefficients of construction steel which is between 10.8 and 12 microstrain per degree C, and begins to approach that of the DVRT stainless steel core. Offset and span errors may be corrected in software by use of an on-board semiconductor temperature sensor (MicroChip model 1046, Chandler, AZ) and an appropriate software correction algorithm which may reside in the remote units microcontroller or may be applied in a post processing routine.

Figure 8. Output of magnetic mount DVRT vs. conventional strain gauge at various temperatures

Field Trials on a Civil Structures

The first field-trial involved placing several datalogging transceiver nodes and magnetic mount DVRT’s on a heavily-trafficked steel girder composite deck bridge spanning the LaPlatte River in Shelburne, VT. The magnetic mount sensors were placed on the bottom flange of the central beam, and also near the bottom of the beam web, as in Figure 3.

Figure 9. Strain data collected during the passage of two large trucks

Installation of each sensor required less than five minutes. The base station was connected to a laptop computer, located approximately 35m away from the sensor nodes. The noise floor measured with no vehicle traffic (+/- 1.5 microstrain) was slightly higher than expected. However, with heavy traffic on the bridge, the system successfully collected and transmitted data. Figure 6 shows data collected while two large trucks traversed the bridge, each traveling in opposite directions.

CONCLUSION

A wireless strain sensor that can be quickly installed, without damaging the target structure has been developed and demonstrated. It can be deployed for long periods of
time, with a collecting strain data at 2 kHz with a resolution of +/-1.5 microstrain. The first field trial was successful. The system is currently undergoing long-term testing to evaluate reliability, drift, and environmental resistance. Enhanced signal conditioners are under development which provides improved thermal stability under harsh operating conditions.

ACKNOWLEDGEMENT
This material is based upon work supported by the National Science Foundation under Grant No. (0078617, 0110217).

REFERENCES:
1. C.P. Townsend, M.J. Hamel, P. Sonntag, B. Trutor, J. Galbreath, and S.W. Arms. 2002. “Scaleable, Wireless Web Enabled Sensor Networks” Sensors for Industry, 2002 Conference.
2. Huston, D. 2001. “Adaptive Sensors and Sensor Networks for Structural Health Monitoring”, Proc. SPIE Complex Adaptive Structures, 4511:203-211.
3. E. Shih, S. Cho, N. Ickes, R. Min, A. Sinha, A Wang, and A. Chandraskan. 2001. “Physical layer driven protocol and algorithm design for energy-efficient wireless sensor networks,” The Seventh
Annual International Conference on Mobile Computing and Networking. 272-287.
4. Hartog, J.P. 1985. Mechanical Vibrations, Dover Edition. McGraw-Hill, New York, pp. 63-64.
5. D. C. Guzik, C.P. Townsend, S.W. Arms. 1998. “Microminiature High-resolution Linear Displacement Sensor for Peak Strain Detection in Smart Structures”, Proc. SPIE Smart Structures and Materials, 3330:30-35.

Per maggiori informazioni contattaci: https://www.lunitek.it/contatta-sensoristica-e-acquisizione-dati/

Settembre 5, 2018 / by / in
LORD MICROSTRAIN – Sensori riprogrammabili a distanza per il Monitoraggio strutturale di ponti e viadotti

Remotely Reprogrammable Sensors for Structural Health Monitoring

S.W. Arms, J.H. Galbreath, A.T. Newhard, C.P. Townsend

Abstract

Wireless sensors can improve our ability to monitor critical civil infrastructure, including highways & bridges. We have previously reported on highly miniaturized, wireless strain, acceleration, and inclination sensing systems capable of providing low & high speed data update rates. Signal conditioning, multiplexing, A/D conversion, processing, amplifying, data logging, and bi-directional wireless communications are fully integrated. Each node includes a unique address (RFID), allowing a single base station to orchestrate data collection from thousands of distinct sensing nodes.

In order to enhance these capabilities, we have produced a new base station with remote cellular telephone interface. This allows access to the sensing network from anywhere where cellular communications are available. Key operating parameters such as triggering, data sampling rates, data sampling duration, continuous streaming duration, and number of active channels may all be programmed remotely. The base station can issue broadcast commands, such as “wake up, begin data logging, or “go back to sleep”. Node specific commands include “download data from node,
remove offsets from a node’s channel, increase gain on a node’s channel”.

These capabilities allow a remote sensing network to be deployed in the field and remotely adapted over time to meet the customer’s unique SHM requirements.

Introduction

Sensors integrated into structures, machinery, & the environment, coupled with the efficient delivery of sensed information, could provide tremendous benefits to society. Potential benefits include: fewer catastrophic failures, conservation of natural resources, improved manufacturing productivity, improved emergency response, enhanced homeland security. Wireless sensing networks can greatly reduce the costs associated with structural health monitoring, because they greatly reduce installation time and cost. The ideal wireless sensor is networked & scaleable, consumes very little power, is smart & software programmable, capable of fast data acquisition, reliable & accurate over the long term, costs little to purchase & install, and requires no real
maintenance [1].

The ability to modify the operating parameters of a wireless sensing network after installation can be critical to success. For example, the triggering parameters of a given sensing node or nodes on the network may need to be modified to accommodate changing strain levels, strain rates, vibration levels, or other operating conditions of the structure. The end user should be able to reconfigure
the installed wireless sensing nodes without being forced to directly connect to each node. The ultimate convenience is to provide the end user with the capability to reconfigure the wireless sensing network without leaving their office.

Objective

The objective of this paper is to describe the methodology used to develop a modular wireless sensor network capable of wireless reprogramming over a long distance cellular phone network. This system would allow an end user to gain control over a complete wireless sensing network from their office – from distances of thousands of miles away from the monitoring site where the sensing network is actually deployed. A concept drawing is provided in Figure 1, below.

Figure 1. Wireless strain sensing nodes distributed over the structure report data to one or more base stations located near the structure. A cellular phone link from the base station allows the sensing network to be controlled and re-programmed to meet the needs of the application from an office located anywhere in the world.

Methodology – Wireless Sensing Node

A functional block diagram of a versatile wireless sensing node is provided in Figure 2, below. A modular design approach provides a flexible and versatile platform to address the needs of a variety of applications. For structural health monitoring (SHM) applications, wireless tri-axial accelerometer nodes and wireless multi-channel strain gauge nodes are frequently deployed. Wheatstone bridge sensor input offsets may be removed using software commands. Bridge completion resistors for quarter and half bridge strain sensors may also be included, allowing a wide variety of strain gauges installations to be accommodated. Modules may also provide software programmable gains.

The bi-directional radio link may be reconfigured in software (frequency and RF power levels) as required for given applications’ wireless range requirement and in order to conform to specific radio communications standards for a particular region of the world. Each node contains a unique 16 bit address within its non-volatile memory. This scheme allows up to 65,536 (2^16) wireless sensing nodes to be deployed on the wireless sensor network. An important strategy to save power is to remotely command the wireless sensing nodes from a base station as required by the specific application. We have previously reported on addressable, wireless strain sensing nodes that respond to base station broadcast address and/or node specific address commands, including commands to sleep, wake up, log data, and stream data continuously [2,3]. However, our previous base station designs could not be controlled from a remote personal computer platform using cellular phone networks.

These addressable sensing nodes feature two Megabytes of on-board, non-volatile memory for data storage, 2000 samples/second/channel logging rates, 1700 samples/sec/channel over-the-air data rates, bi-direction RF link with remote offset and gain programmability, compact enclosure, integral rechargeable Li-Ion battery, and on-board temperature sensor. Figure 2 provides a photograph of a wireless strain sensing nodes packaged within an IP67, NEMA 4X rated environmentally sealed outdoor enclosure. The package includes neodymium magnetic mounts to provide easy mounting to steel structural elements. Cable glands allow lead wires from multiple strain gauges to enter the enclosure while maintaining the integrity of the water tight seal. We have used weldable strain gauges (350 ohms, quarter bridge, Micro-Measurements) with good success. These gauges are well protected from the environment and can be installed very quickly using a portable, battery powered spot welder.

Figure 2. Wireless Sensor Node Block Diagram

Base Station Software Interface

In order to facilitate data collection, triggering, and programming of the wireless sensing nodes, a base station was placed on the structure within 160 meters (500 feet) of the sensing nodes. Figure 3 also depicts the Base Station, which was housed in a heated NEMA 4X enclosure and contained a digital radio receiver with RS-232 output, Panasonic “Toughbook” personal computer (PC), 802.11b WiFi card with PCMCIA interface to the notebook PC, and cellular telephone with modem interface. The base station was connected to a local power source (110 VAC) through an uninterruptible power supply to prevent loss of power during temporary outages and to protect against power drop out and/or surges. The system was deployed on a large civil structure in North America: the Ben Franklin Bridge, spanning the Delaware River from Camden NJ to Philadelphia, PA.

The system was designed to acquire strain data when trains passed on the bridge, but this required that the trigger levels be optimized for each strain sensor placement. The WiFi card allowed us to gain control of the system from under the bridge, which proved helpful when the triggering parameters were initially set up. The cellular phone interface was intended to provide a greater level of programmability and distant (remote) access into the wireless sensing network. The cell phone interface also allowed data to be copied or moved from the notebook computer platform on the bridge to another computer (or server) located on the local area network where another cell phone was used to establish the connection. The following figures (nos. 4-9) are screen shots from the Base Station (PC side) and “Strain Wizard ™ ” software used to configure & calibrate the nodes remotely, using bi-directional wireless communications as required for an SHM applications. The software was written for use on Windows 95/98/2000/XP platforms.

Figure 3. Wireless Sensing Nodes (4) in sealed NEMA 4X enclosures (top of photo). Base Station with Panasonic Toughbook ®, cell phone, 802.11b WiFi card, and narrowband RF Transceiver as packaged within sealed, thermally controlled enclosure (at bottom of photo).

Figure 4. Software interface (on right) used to manually set up the number of active channels, as well as the offset and gain values for specific sensors on a channel-bychannel basis. The end user can also request that the software “sample” a specific channel on the wireless node to obtain an instantaneous snapshot.

Figure 5. Software interface (on left) used to control sleep intervals between checks for commands from the base station. The inactivity timeout allows the node to go into micropower sleep mode if no commands or event triggers are detected.

Figure 6. Software interface (on right) used to set up the sampling parameters of a specific wireless node on the network, specifically the sweep rate and total number of sweeps. The program automatically calculates the duration of the sample based on these two parameters for both data logging and streaming modes.

Figure 7. Software interface to provide the user with requisite gain and offset values after the remote balancing & shunt calibration steps have been performed.

Figure 8. Software interface to indicate results of remote (wireless) shunt calibration of a specific node on the wireless network. In this case, node 25 has been shunt calibrated.

Figure 9. Software interface to display real time streaming data on a continuous basis from a specific node on the wireless network. In this case, node 91 reports in real time.

Cellular Telephone Link

Integration of cell phone and PC display redirection technologies provide remote base station control and node configuration options wherever cell phone coverage is available. The remote connection software engages in directly connecting to the internet based on the Microsoft Task Scheduler (Redmond, WA). This scheduling software allows the user to define when an internet connection should be established in a myriad of schemes ranging from set intervals such as weekly, daily, or hourly or exact time and date instances such as every second month at three in the morning.

During each connection session, an email is sent to a list of recipients containing detailed information on the base station’s internet location. This email list remains persistent amid system reboots as the list remains stored in the Window’s system registry and is editable via the remote data acquisition software. The user is provided with a window of opportunity (15 minutes) to connect to the base station, at which time they may cancel the automatic disconnect event and remain linked to the base station for as long as they desire. Connecting to the base station is executed through the use of remote display redirection software titled RealVNC; software initially developed by AT&T Laboratories in Cambridge, England and now available as open source. Through the assistance of this virtual network computing software, the user may operate on any aspect of the wireless network available to them as though they were physically in front of the base station’s PC. Upon expiration of the allotted connection window with no connection establishment or an explicit disconnect by the user, the cell phone line severs its link and attempts internet connection at its next scheduled time.

Discussion

A versatile wireless sensing system with remote reprogramming capabilities has been built and demonstrated. The graphical user interface may be controlled remotely using a cellular telephone interface. This system has potential to be used for advanced, remote condition based maintenance & structural health monitoring for a wide variety of machines and civil structures. A full system installation including ten wireless strain & temperature sensing elements, and two cell phone enabled base stations has been completed on the Ben Franklin Bridge, which is a major span crossing from Camden NJ, to Philadelphia, PA (Figure 10, below). The bridge is remotely accessible via remote software as described in this paper and is currently reporting strain data when passenger trains cross the bridge.

Figure 10. The Ben Franklin Bridge spans the Delaware River, with ten strain sensors periodically checking strain levels on a continuous basis at ~1 Hz sample rates. The presence of a passenger train creates a change in strain rate, which triggers automated data acquisition at 32 Hz sample rates by the wireless strain sensing nodes.

REFERENCES:
1. Arms, S.W., Townsend, C.P. (2003): Wireless Strain Measurement Systems, Applications & Solutions, Presented at NSF-ESF Joint Conference on Structural Health Monitoring Strasbourg, France
2. Galbreath, J.H, Townsend, C.P., Mundell, S.W., Hamel M.J., Esser B., Huston, D., Arms, S.W. (2003): Civil Structure Strain Monitoring with Power-Efficient High-Speed Wireless Sensor Networks, Proceedings International Workshop for Structural Health Monitoring, Stanford, CA
3 Townsend C.P, Hamel M.J., Arms S.W. (2001): Telemetered Sensors for Dynamic Activity & Structural Performance Monitoring, SPIE’s 8th Annual Int’l conference on Smart Structures and
Materials, Newport Beach, CA
ACKNOWLEDGEMENTS:
The authors are grateful for the partial support from the National Science Foundation’s SBIR program. We also want tothanks to the Delaware River Port Authority in Camden, N.J., which provided us with the opportunity to demonstrate our systems on the Ben Franklin Bridge.

Per maggiori informazioni contattaci: https://www.lunitek.it/contatta-sensoristica-e-acquisizione-dati/

Settembre 4, 2018 / by / in
LORD MICROSTRAIN – Reti di sensori wireless per il Monitoraggio delle prestazioni a lungo termine di ponti e viadotti

Wireless Sensor Networks for Improved Long-Term Bridge Performance

Todd Nordblom* and Jacob Galbreath
MicroStrain, Inc.
459 Hurricane Lane, Suite 102
Williston, VT 05495

The structural performance of bridges is highly dependent on a variable combination of local conditions, use profiles, and design parameters. There are currently more than 600,000 bridges in the United States.1 According to the Federal Highway Administration (FHWA), one out of every four bridges is categorized as either structurally deficient or functionally obsolete. Yet, existing inspection-based maintenance procedures do not adequately address the growing sustainment cost and safety concern related to this aging infrastructure. In order for the Nation’s bridge network to support long-term use at a feasible cost, future bridge management initiatives will require scalable, high-resolution health monitoring and modeling capabilities.

Extracting better operational performance data is essential for improving bridge management. Utilizing sensor networks for detailed inspection, periodic evaluation, and long-term monitoring shall provide a means to quantify the effectiveness of various maintenance, preservation, repair and rehabilitation strategies. Furthermore, high-resolution structural performance data has also
been shown to improve deterioration modeling, validate life-cycle cost analysis, and support the development of next generation Bridge Management Systems.

Advances in wireless sensor networks have the potential to enable cost efficient, scalable bridge monitoring systems that can be tailored for each bridge’s particular requirements. Eliminating
long runs of wiring from each sensor location greatly simplifies system installation, enhances reliability and allows large arrays of sensor nodes to be rapidly deployed. As a leading developer and manufacturer of wireless sensor solutions, MicroStrain is uniquely positioned to address the performance monitoring needs of bridge infrastructure.

Long-Term Performance Diagnostics/Prognostics

MicroStrain’s wireless structural monitoring system is a new network tool for enhanced long-term performance diagnostics and prognostics. Network capabilities include an autonomous, energy
independent sensor platform for streamlined installation and reduced battery maintenance. Wireless capabilities eliminate the cost and installation burden of cabling. As a result, sensors can be quickly deployed in discrete locations with less disruption on traffic and concurrent construction. Additionally, a cloud-based management and modeling tool supports any MicroStrain wireless or third party health and usage data. Current commercial applications include bridges, aircraft and manufacturing processes.

Figure 1. MicroStrain Bridge Monitoring Systems currentlysupport state, federal and foreign bridge infrastructure

A diverse portfolio of miniature sensor nodes provides measurement capabilities for performance parameters such as vibration, load, strain, displacement, temperature, corrosion and tilt/inclination. New techniques for integrating advanced sensing capabilities into structural and load bearing design elements enable embedded monitoring intelligence to be permanently architected into the structure. In addition, low-power, synchronized data communication protocols facilitate wireless transmission that can support thousands of nodes on a single base
station, without compromising reliability.

Wireless Monitoring

Repeated traffic loading imparts significant strain on bridge structures. Servicing infrastructure, quantifying usage, and predicting failure requires monitoring numerous positions and parameters. Wired sensors are subject to scale and environment limitations that prevent broader deployment. Furthermore, hardwired solutions are difficult and disruptive to install, expensive to maintain, and do not readily transfer between bridge designs. Wireless sensor networks can be deployed with greater scale and cost-efficiency on remote, high value equipment. MicroStrain has developed integrated wireless monitoring solutions for many structural applications. (Figure 2)

Figure 2. MicroStrain miniature wireless accelerometer 

These include civil bridge projects2 and defense aircraft applications3, and they provide significant innovation in these areas. Advanced data synchronization capabilities ensure wireless aggregation of sensor information using time as a unifying variable. Ultra-low power FRAM memory and event driven triggers on each node allows the network to capture key health and usage information with less energy. Additionally, scalable system characteristics support the distribution of many sensors in a single network. Networks support landline, cellular or satellite communication. Virtually any sensor can be used with the MicroStrain network. As a result, operators can tailor monitoring to provide their necessary channels.

Rapid Installation
Bridge operators cannot afford to disrupt or complicate normal bridge operation with cumbersome monitoring systems and installation practices. Disruptions to concurrent construction activities or traffic flow undermine the cost and convenience of enhanced sensing capabilities. MicroStrain miniature sensors rapidly install on existing bridges and integrate with future bridge designs. (Figure 3)

Figure 3. Scalable wireless network supports quick installation of distributed miniature sensors

Wireless nodes enable discrete placement without labor intensive and damage prone wire trails. The network supports detailed inspection, periodic evaluation, and long-term monitoring. Additionally, for new construction, Wireless Integrated Shear Pins (WISP), first designed to monitor loads, fatigue, and damage on aircraft landing gear, provide fully calibrated, environmentally sealed integrated performance monitoring capabilities. MicroStrain’s miniature wireless nodes are also capable of synchronized data acquisition from accelerometers, geophones, bonded or welded strain gauges, LVDTs, thermocouples, and corrosion sensors. Automated bridge monitoring from remote sites is supported by our wireless sensor data aggregators (WSDAs), which collect data from the scalable sensor network using time as a unifying variable.

Energy Independent
Remote assets are highly limited in their access to conventional sources of energy. In temporary monitoring application of a short duration, MicroStrain’s ultra-low power microelectronics can be sufficient to provide autonomous operation. The monitoring system offers efficiently scheduled data transmission protocols as well as an event driven sleep mode to maintain requisite data with minimal power. However, permanent solutions are necessary to extract meaningful life-cycle performance metrics. Eliminating battery maintenance through the application of renewable, harvested energy can provide long-term power for self-sufficient wireless monitoring solutions. Solar energy is a logical choice for many regions of America’s highway infrastructure. Solar energy
harvesting devices can decouple sensor nodes from the limitations of traditional power supplies. MicroStrain’s experience includes developing solar, strain, vibration and thermal powered sensor
networks. (Figure 4)

Figure 4. Energy harvesting elements enable autonomous,long-term monitoring

The deployment of a self-powered miniature sensor can significantly enhance data extraction capabilities while simultaneously reducing the need for visual inspections and battery maintenance.

Secure, Cloud-Based Data
Continuous health and usage monitoring generates massive datasets. This data is necessary for optimizing operation and maintenance, but it can also create data visualization and management challenges. MicroStrain’s SensorCloud™ offers a secure, cloud-based sensor data management platform with virtually unlimited storage, rapid visualization capabilities, and user-defined alert
channels. (Figure 5)

Figure 5. SensorCloud™ screenshot showing wireless temperature, strain and displacement bridge data

SensorCloud™ makes big data highly accessible and allows engineers to drill down on individual data points in seconds. SensorCloud™ is equipped with on-board analytical and modeling tools to allow users to develop, verify, and validate new algorithms. Furthermore, the open API platform supports importation of analytical metrics and  additional data types (such as annotative notes and images.) By these means, usage patterns such as number of crossings, average daily load traffic, resonant frequency, and cumulative fatigue can be leveraged over the long-term for more effective resource prioritization.

Live Connect
Accessibility is integral to maintaining an effective remote monitoring network. Through its cloud-based data exchange platform, MicroStrain’s wireless network supports live remote access and control. Long-term data are pushed to the cloud using cellular network, as well as being locally archived within the wireless data aggregator. (Figure 6)

Figure 6. Live Connect enables bridge operators to remotely access and control performance monitoring

As a result, users can configure, manage and maintain distributed monitoring systems more efficiently and at a lower cost.  MicroStrain’s Live Connect also enables bridge operators to remotely monitor live bridge performance during controlled testing events. Leveraging strain events, such as the defined crossing of traffic loads, the performance of specific locations can be remotely observed in real time.

Bridge Monitoring Experience

MicroStrain has supported numerous major wireless installations that actively monitor the structural strains and seismic activities of major bridge spans. 4 , 5 One example is the Ben Franklin Bridge that spans the Delaware River from Philadelphia, PA to Camden, NJ.6 The wireless monitoring system was accessed remotely over a cellular telephone link. The wireless nodes measured structural strains in the cantilever beams as passenger trains transverse the span. Measurements were taken over several months to quantify bridge fatigue. Performance monitoring validated that the bridge was operating within its designed range, and allowed operators to avoid a costly overhaul.

Figure 7. Goldstar Bridge in New Haven, CT

MicroStrain has also deployed self-powered wireless bridge monitoring system for state, federal, and foreign bridge programs. Examples of these include the Great Road State Bridge in North Smithfield, RI, the Goldstar Bridge spanning the Thames River in New Haven, CT, and the Corinth Canal Bridge in Corinth, Greece. (Figure 7) Each site integrates miniature solar energy harvesters to power a network consisting of MicroStrain’s wireless sensor data aggregator and wireless nodes. In Corinth, a seismically active region, the bridge design featured partial seismic isolation, and the bridge operator wanted to assess the effectiveness of the isolation design during actual seismic events. The system samples accelerations continuously at 200 Hz. A circular memory buffer with event triggers automatically retrieves and saves pre- and post-event data when user-defined thresholds are met.

Application of MicroStrain’s cloud-based data exchange has enabled bridge operators and collaborative research programs to autonomously aggregate, visualize, and analyze high-resolution
health and usage data. Data collection requirements often exceed 1GB/day for a 100Hz, 10-node network. Larger spans can require hundreds, if not thousands of embedded sensors. Over time,
maintaining and collaborating on bridge performance data can present a substantial burden. SensorCloud™ has enabled bridge researcher engineers to cost effectively maintain, share and model bridge performance on virtually any scale.

The coupling of advanced wireless sensor networks with innovative cloud-based data analytics revolutionizes performance monitoring of remote structures. Used over the long-term, operators can gain valuable insight into the deterioration of structures and its corresponding effect on performance. By making bridge monitoring systems less disruptive to install and easier to manage, these benefits can be achieved more efficiently, and on a greater scale. As a result, both existing and next generation infrastructure can access the values of condition based maintenance, repair and modeling.

REFERENCES:
1 U.S. Department of Transportation
2 Arms, S. W. et al., “Remotely Reprogrammable Sensors for Structural Health Monitoring,” Structural Materials Technology (SMT):NDE/NDT for Highways and Bridges, Sept 16, 2004, Buffalo, NY
3 Arms, S.W. et al., “Flight Testing of Wireless Sensing Networks for Rotorcraft Structural Health and Usage Management Systems”, accepted for presentation at AIAC14, 28 Feb – 3 Mar 2011, Melbourne, Australia
4 Townsend C.P., Hamel, M.J., Arms, S.W.; “Scaleable Wireless Web Enabled Sensor Networks”, proc. SPIE’s 9th Int’l Symposium on Smart Structures & Materials and 7th Int’l Symposium on Nondestructive Evaluation and Health Monitoring of Aging Infrastructure, San Diego, CA, paper presented 17-21 March, 2002
5 Galbreath J.H., Townsend, C.P., Mundell, S.W., Arms, S.W; “Civil Structure Strain Monitoring with Power-Efficient High-Speed Wireless Sensor Networks”, International Workshop for Structural Health Monitoring, by invitation, Stanford, CA, September 2003
6 Rong, A.Y. & Cuffari, M.A.; “Structural Health Monitoring of a Steel Bridge Using Wireless Strain Gauges” Structural Materials Technology VI, pages 327-330, NDE/NDT for Highways & Bridges, Buffalo, NY, 16 Sep 2004


Per maggiori informazioni contattaci: https://www.lunitek.it/contatta-sensoristica-e-acquisizione-dati/


Settembre 3, 2018 / by / in
NOVATEL – Avviso di EOL per i ricevitori delle serie OEM638 e OEM638V NOVATEL

External Notice: NovAtel Announces End of Life for OEM638 and OEM638V Receiver Boards

NovAtel Inc. is announcing the End of Life of the:
OEM638 and OEM638V series boards (see discontinued part numbers below)

These products will be available for order until:
November 15, 2018

Shipments may be scheduled for no later than:
May 15, 2019

NovAtel will continue to support and repair these products until:
March 31, 2021

For a complete list of affected part numbers and the associated replacement part numbers, please refer
to the table below:


Discontinued Part Number Replacement Part Number
OEM638-xxx-xxx-xxx No direct replacement, see OEM7 series
OEM638V-xxx-xxx-xxx No direct replacement, see OEM7 series

Notes:
• Software models between OEM6 and OEM7® are defined differently.

For information on the OEM7 series receivers, please visit the NovAtel website:
http://www.novatel.com/products/gnss-receivers/oem-receiver-boards/oem7-receivers/

Per maggiori informazioni contattaci: https://www.lunitek.it/contatta-sensoristica-e-acquisizione-dati/

Settembre 3, 2018 / by / in